
Risk Mitigation Benefits of Soil Health Practices: Recent Findings from Five Midwest States (Blog Post - Fall/Winter 2025)
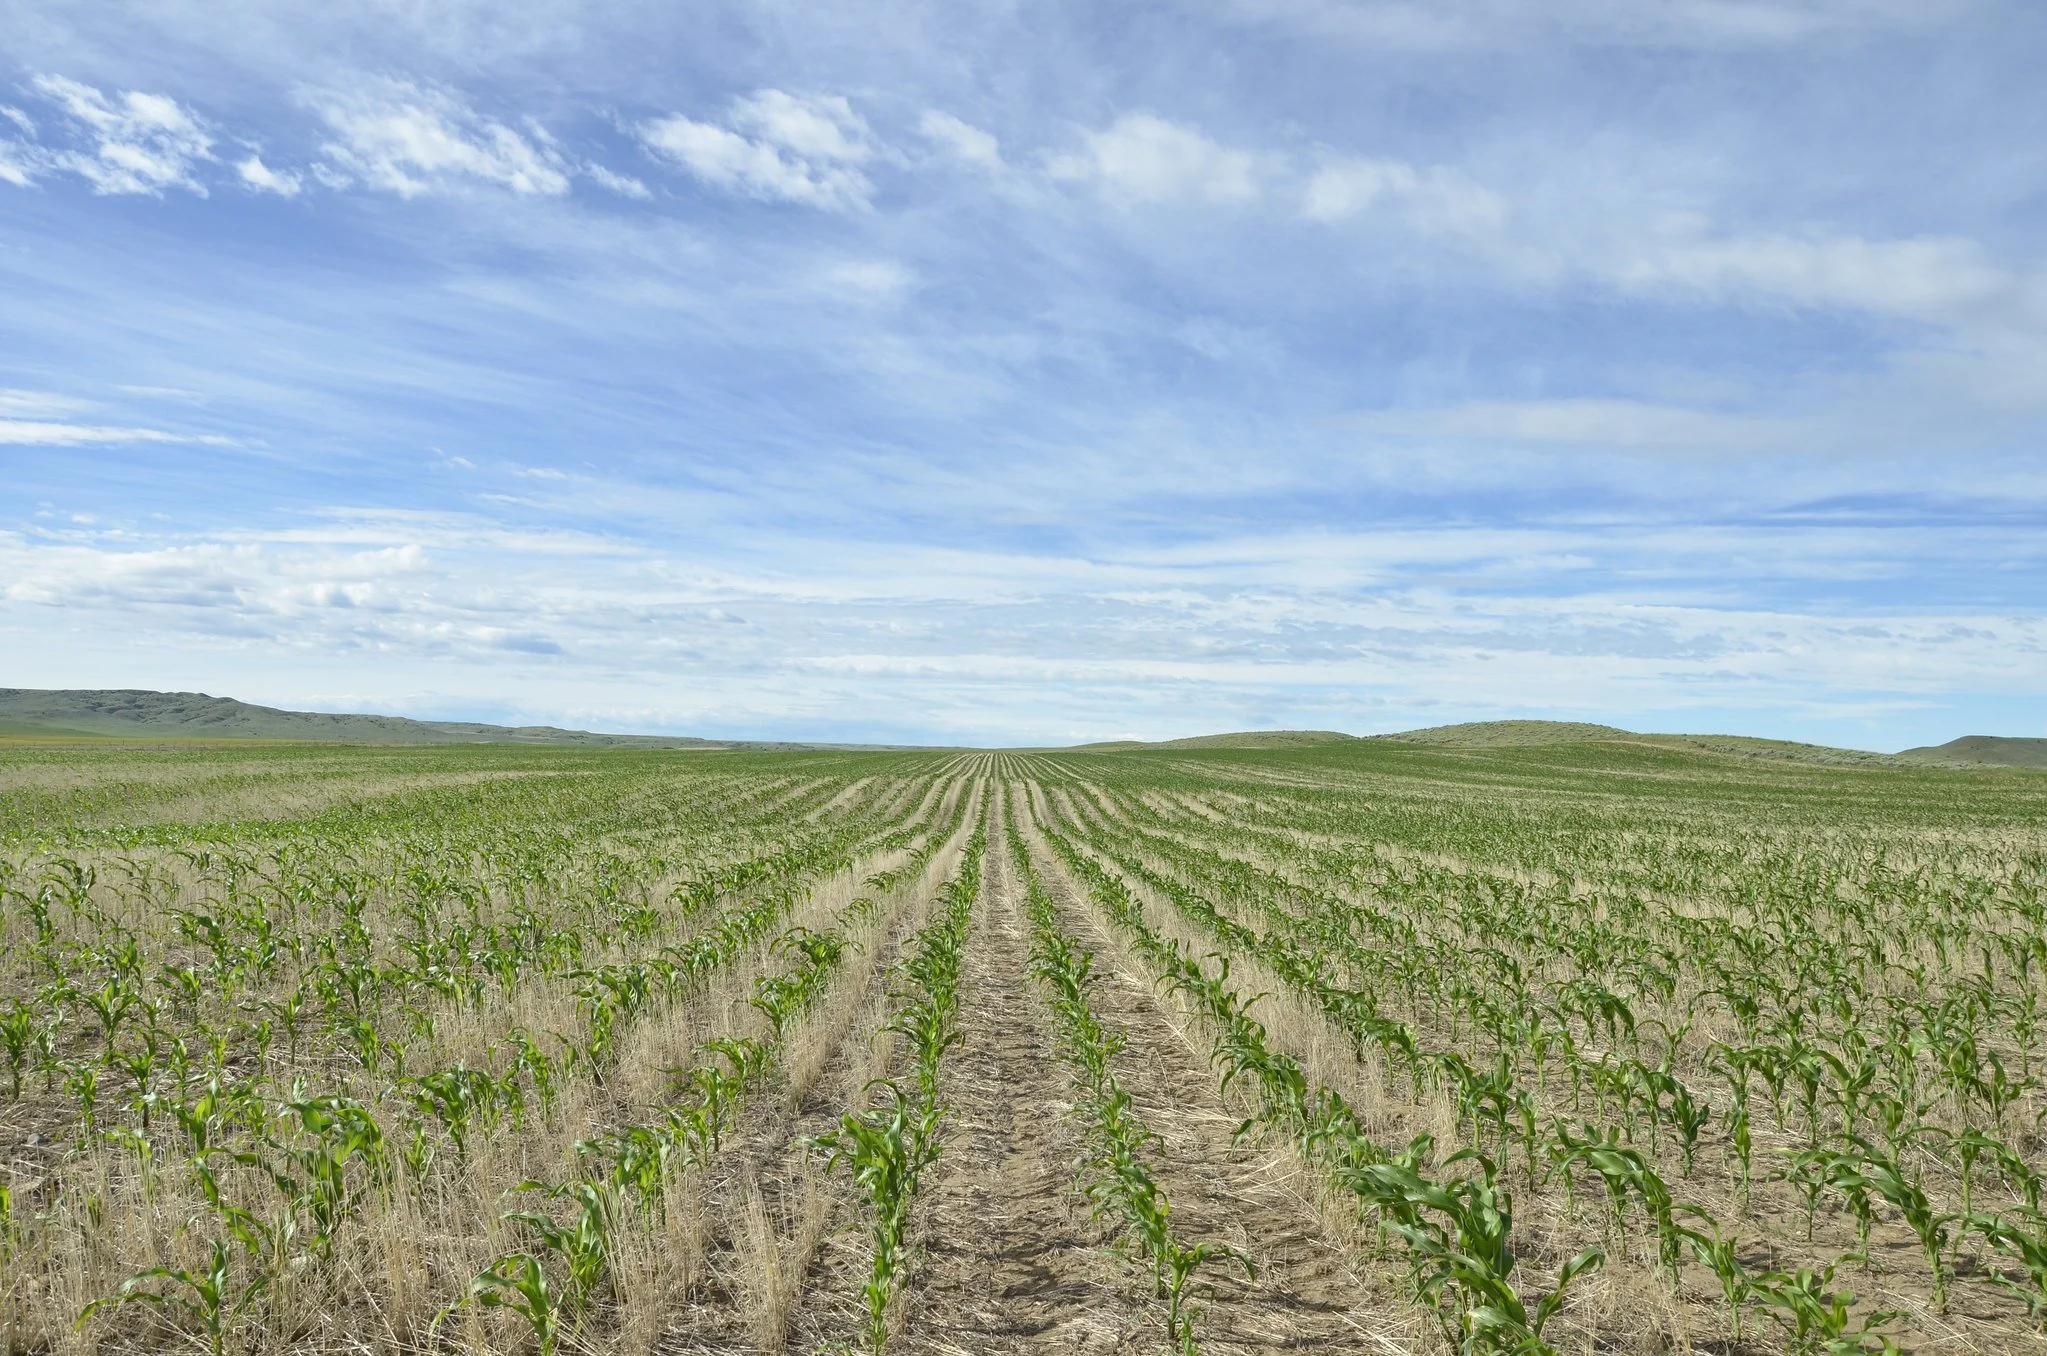
Image from USDA-NRCS’s Flickr.
We are pleased to share findings from a recently released paper by Dr. Gina Pizzo, Lead Analyst for our Land Core Risk Model project. This work directly informs our risk model tool and was written as part of our FFAR and USDA AFRI-funded project examining how soil health practices reduce risk.
The research summarized below advances Land Core’s ongoing work to quantify how known soil health practices build resilience in agricultural systems.
Our Risk Model team achieved a significant milestone when Dr. Pizzo defended her dissertation entitled "Harnessing the Power of Applied Statistics to Contribute to Scientific Knowledge Production" at Michigan State University. This research provides valuable insights into five-state findings on how soil health-related farming practices reduce yield risk. We extend our congratulations to Dr. Pizzo and our deep gratitude to the entire risk modeling team for their contributions to these findings.
These recent findings demonstrate how soil health practices, particularly crop diversification, affect corn yields under varying climate conditions across 5 Midwestern states: Illinois, Minnesota, Ohio, Wisconsin and South Dakota. Using Bayesian hierarchical models, the research quantifies the risk-mitigating effects of soil health land management practices, showing that increased crop rotational complexity reduces risks related to both yield and revenue for farmers. The analysis integrates economic modeling to account for commodity price volatility, revealing that soil health practices help farmers reduce downside risks while capturing more value from ecosystem services. These findings will be leveraged to directly inform the Land Core Risk Model Tool that will benefit agricultural policy, including Risk Management Agency (RMA) crop insurance pricing, and support lenders and insurers to better assess and price the risk-reduction benefits of soil health practices.
Key Findings:
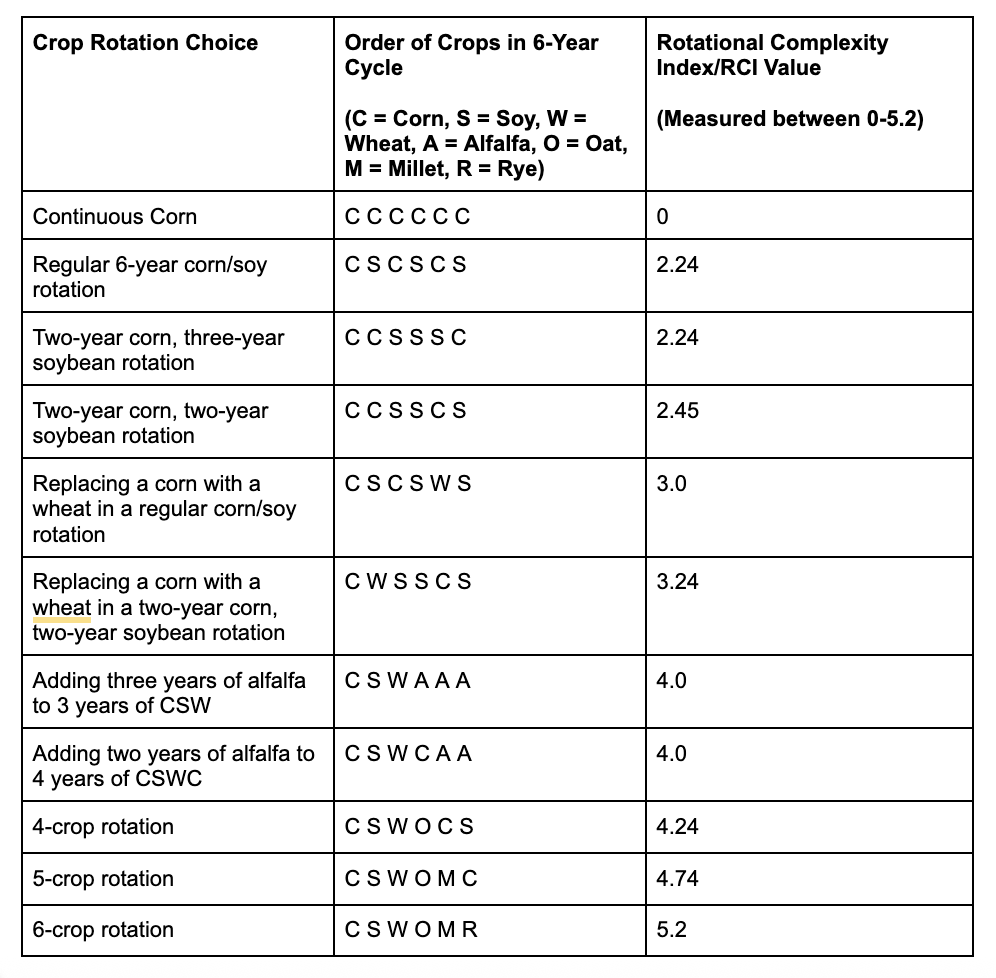
The main soil health practice we've explored thus far is increasing the number of crops in rotation and diversifying the patterns of those rotations, otherwise known as the Rotational Complexity Index (RCI). The concept of RCI was created by original Land Core Risk Model team member Dr. Yvonne Socolar and colleagues in a 2021 paper, and represents the effect of diversification within a rotation, and how it may reduce crop yield risk. RCI is calculated using the crops in rotation over 6 years, and its values range from 0-5.2, with 0 representing continuously growing the same crop in each of the six years, and 5.2 representing growing six different crops in every one of those six years. It is important to note that the numerical RCI value (0-5.2) does not represent the number of crops in a six-year rotation. The RCI formula also includes a term to avoid penalizing the use of 2 or 3 successive years of forage (e.g., alfalfa) and other perennials, as these cropping choices are known to have soil health benefits.
Below are some examples of common crop rotation choices with their corresponding RCI values to give a sense of how the RCI scale operates:
Key crop yield risk findings are:
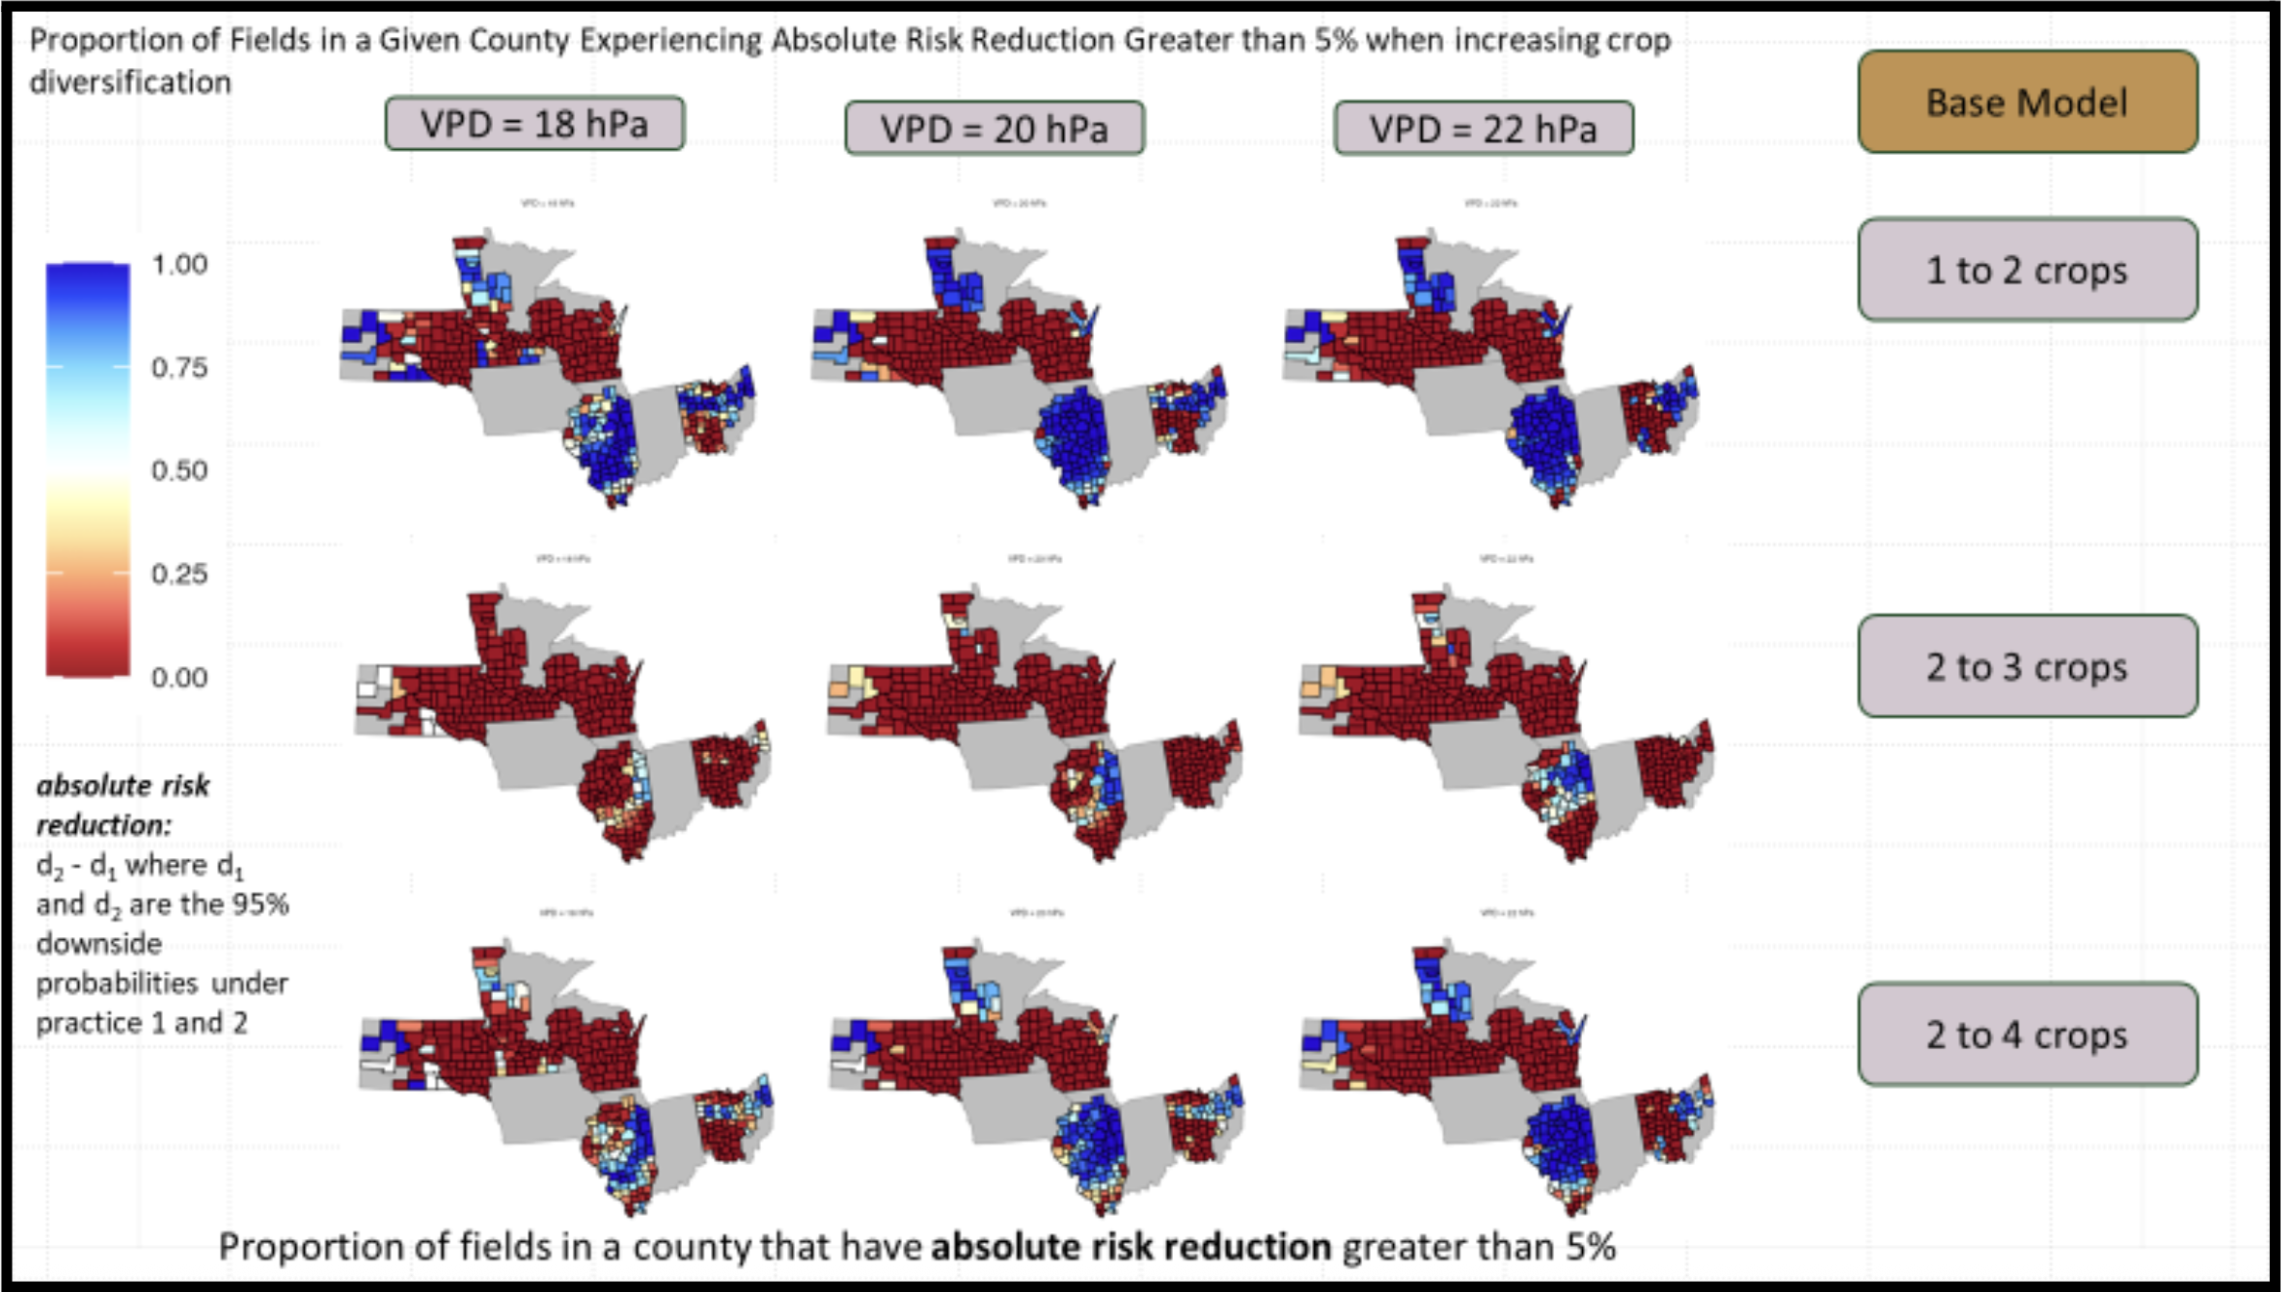
1. In nearly every Illinois county, over 75% of farmers reduce their risk by adding more crops to their rotation, whether going from one to two crops, two to three, or two to four, and regardless of weather conditions. Thus, these cropping scenarios do not harm the production of cash crops in the vast majority of cases. This trend is consistent across most of the 5-state region.
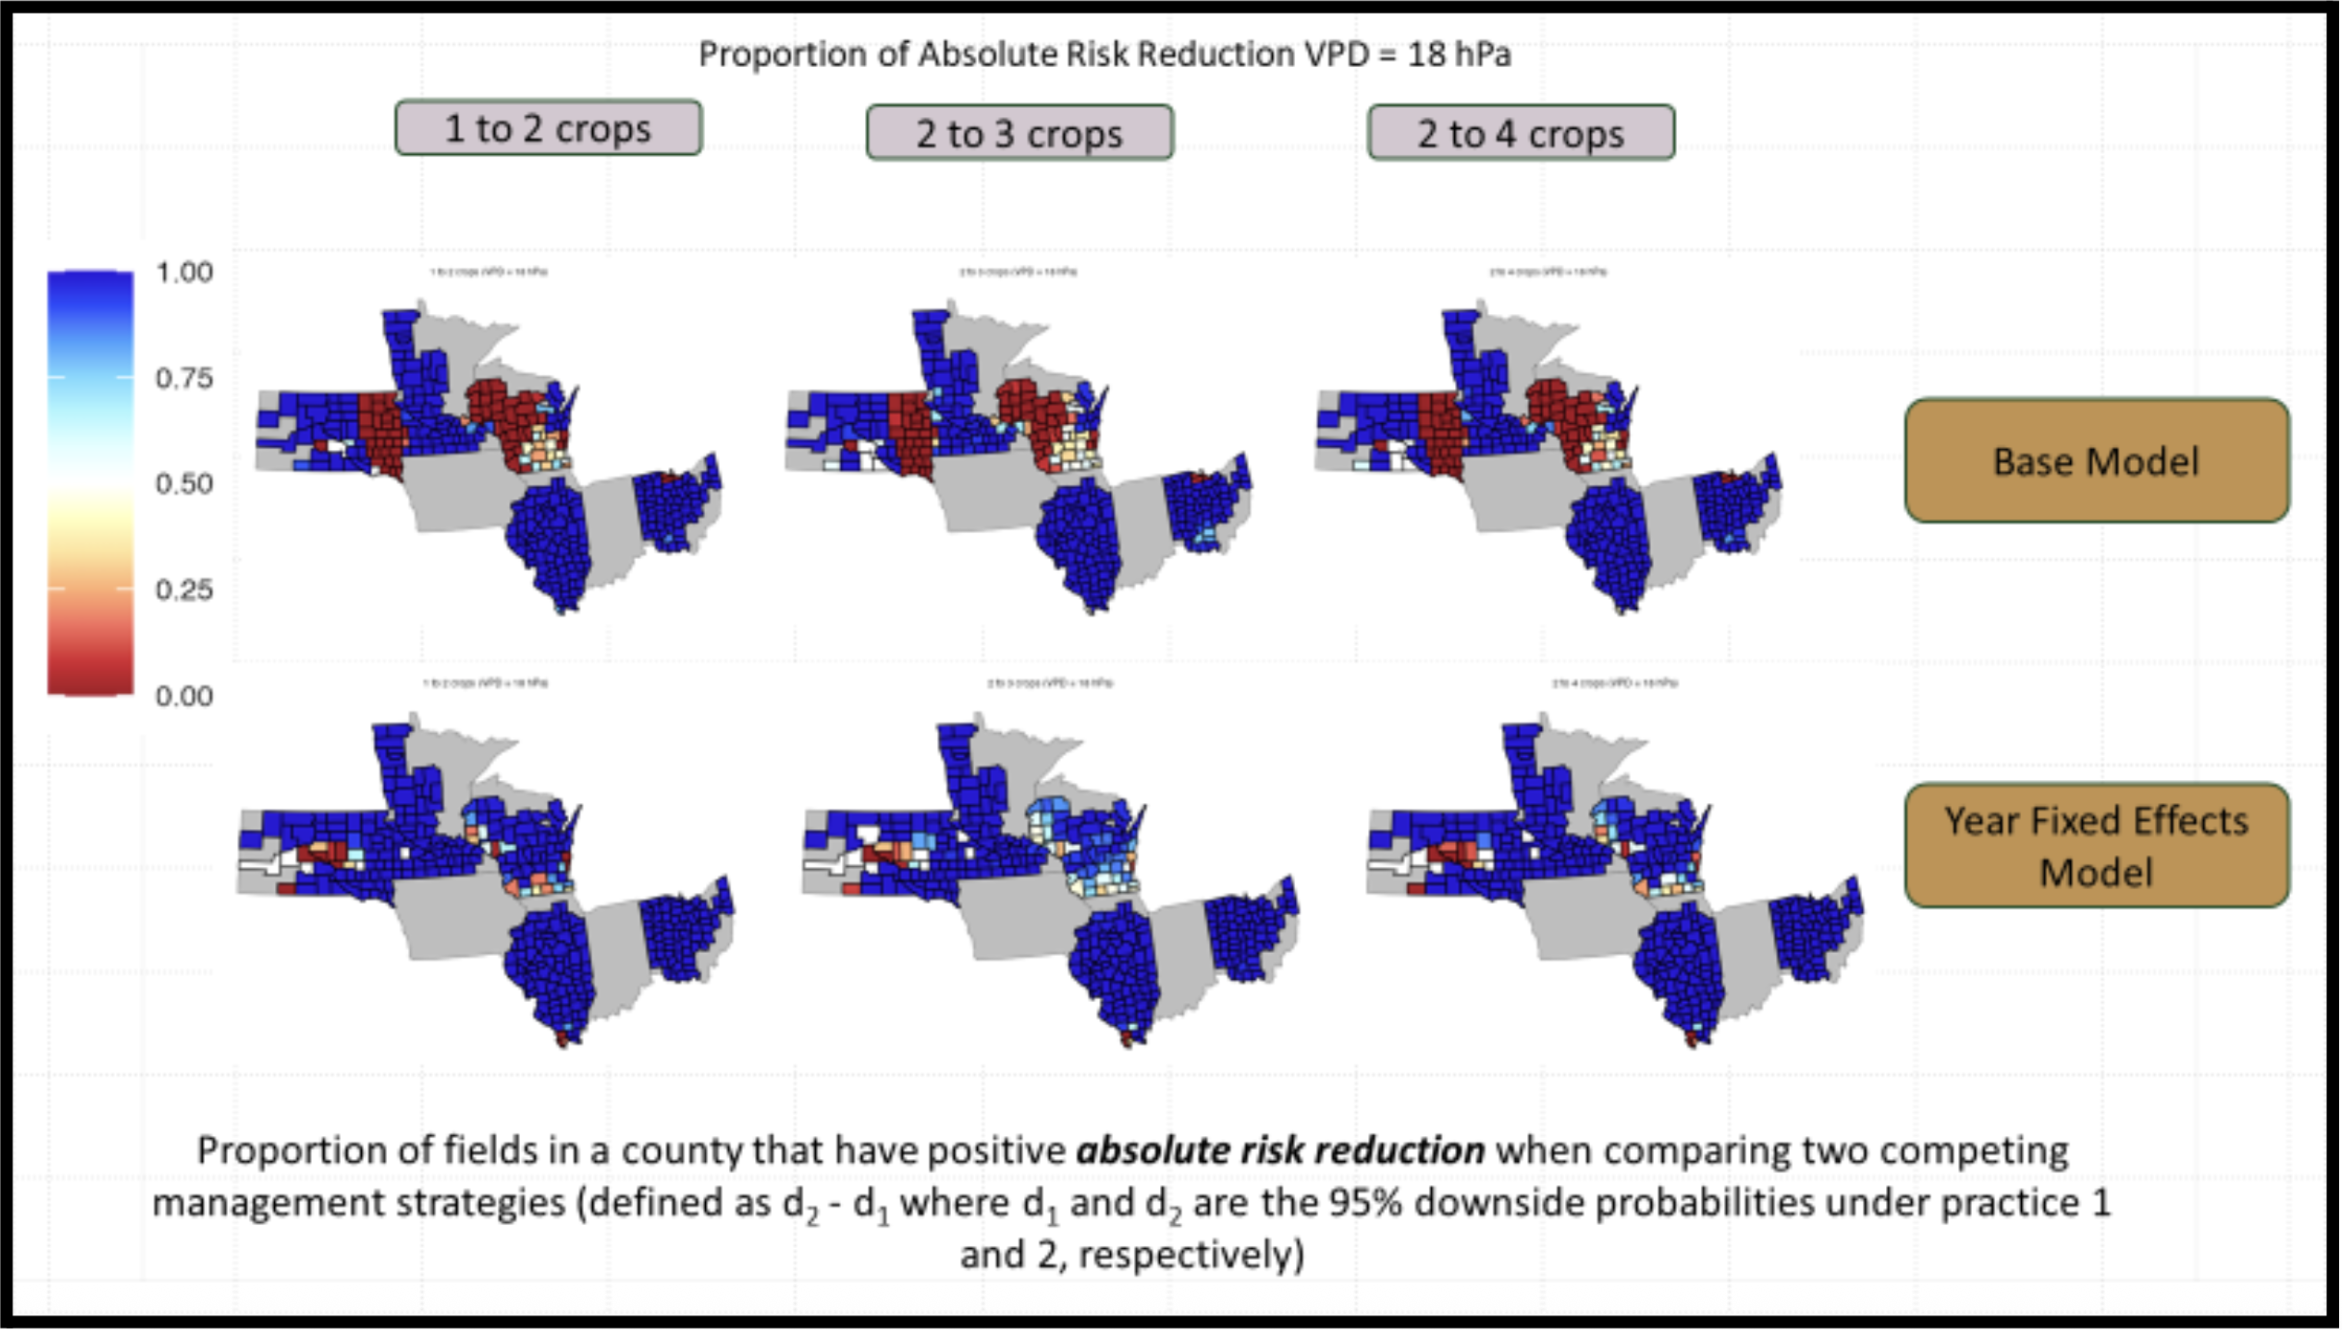
White areas indicate that at least half of the fields in this county experience reduced risk.
Light blue areas indicate that at least three-quarters of the fields in this county experience reduced risk.
Dark blue areas indicate that all of the fields in this county experienced reduced risk.
The prevalence of dark blue demonstrates that in nearly all Illinois counties, close to 100% of fields experience reduced risk.
The risk reduction findings from Illinois hold true across most counties in all five states: the vast majority of farmers experience positive risk reduction without harming cash crop production. The few exceptions are in parts of Wisconsin and South Dakota.
These exceptions form distinct geographic patterns:
Northwest Wisconsin (dark red): These areas show no risk reduction and are characterized by forested, hilly terrain with limited row-crop agriculture compared to other Midwest regions.
Southeast Wisconsin (white): About half of fields experience risk reduction in these areas, which include hilly terrain where dairy farming is more prevalent than cash crops.
Eastern South Dakota (inconsistent results): This region appears dark red in the base model but blue in the year-fixed-effects model. The reason for this discrepancy is unclear, though irrigation differences may play a role. Our team plans to explore this further with the assistance of a Computational Hydrologist in future modeling.
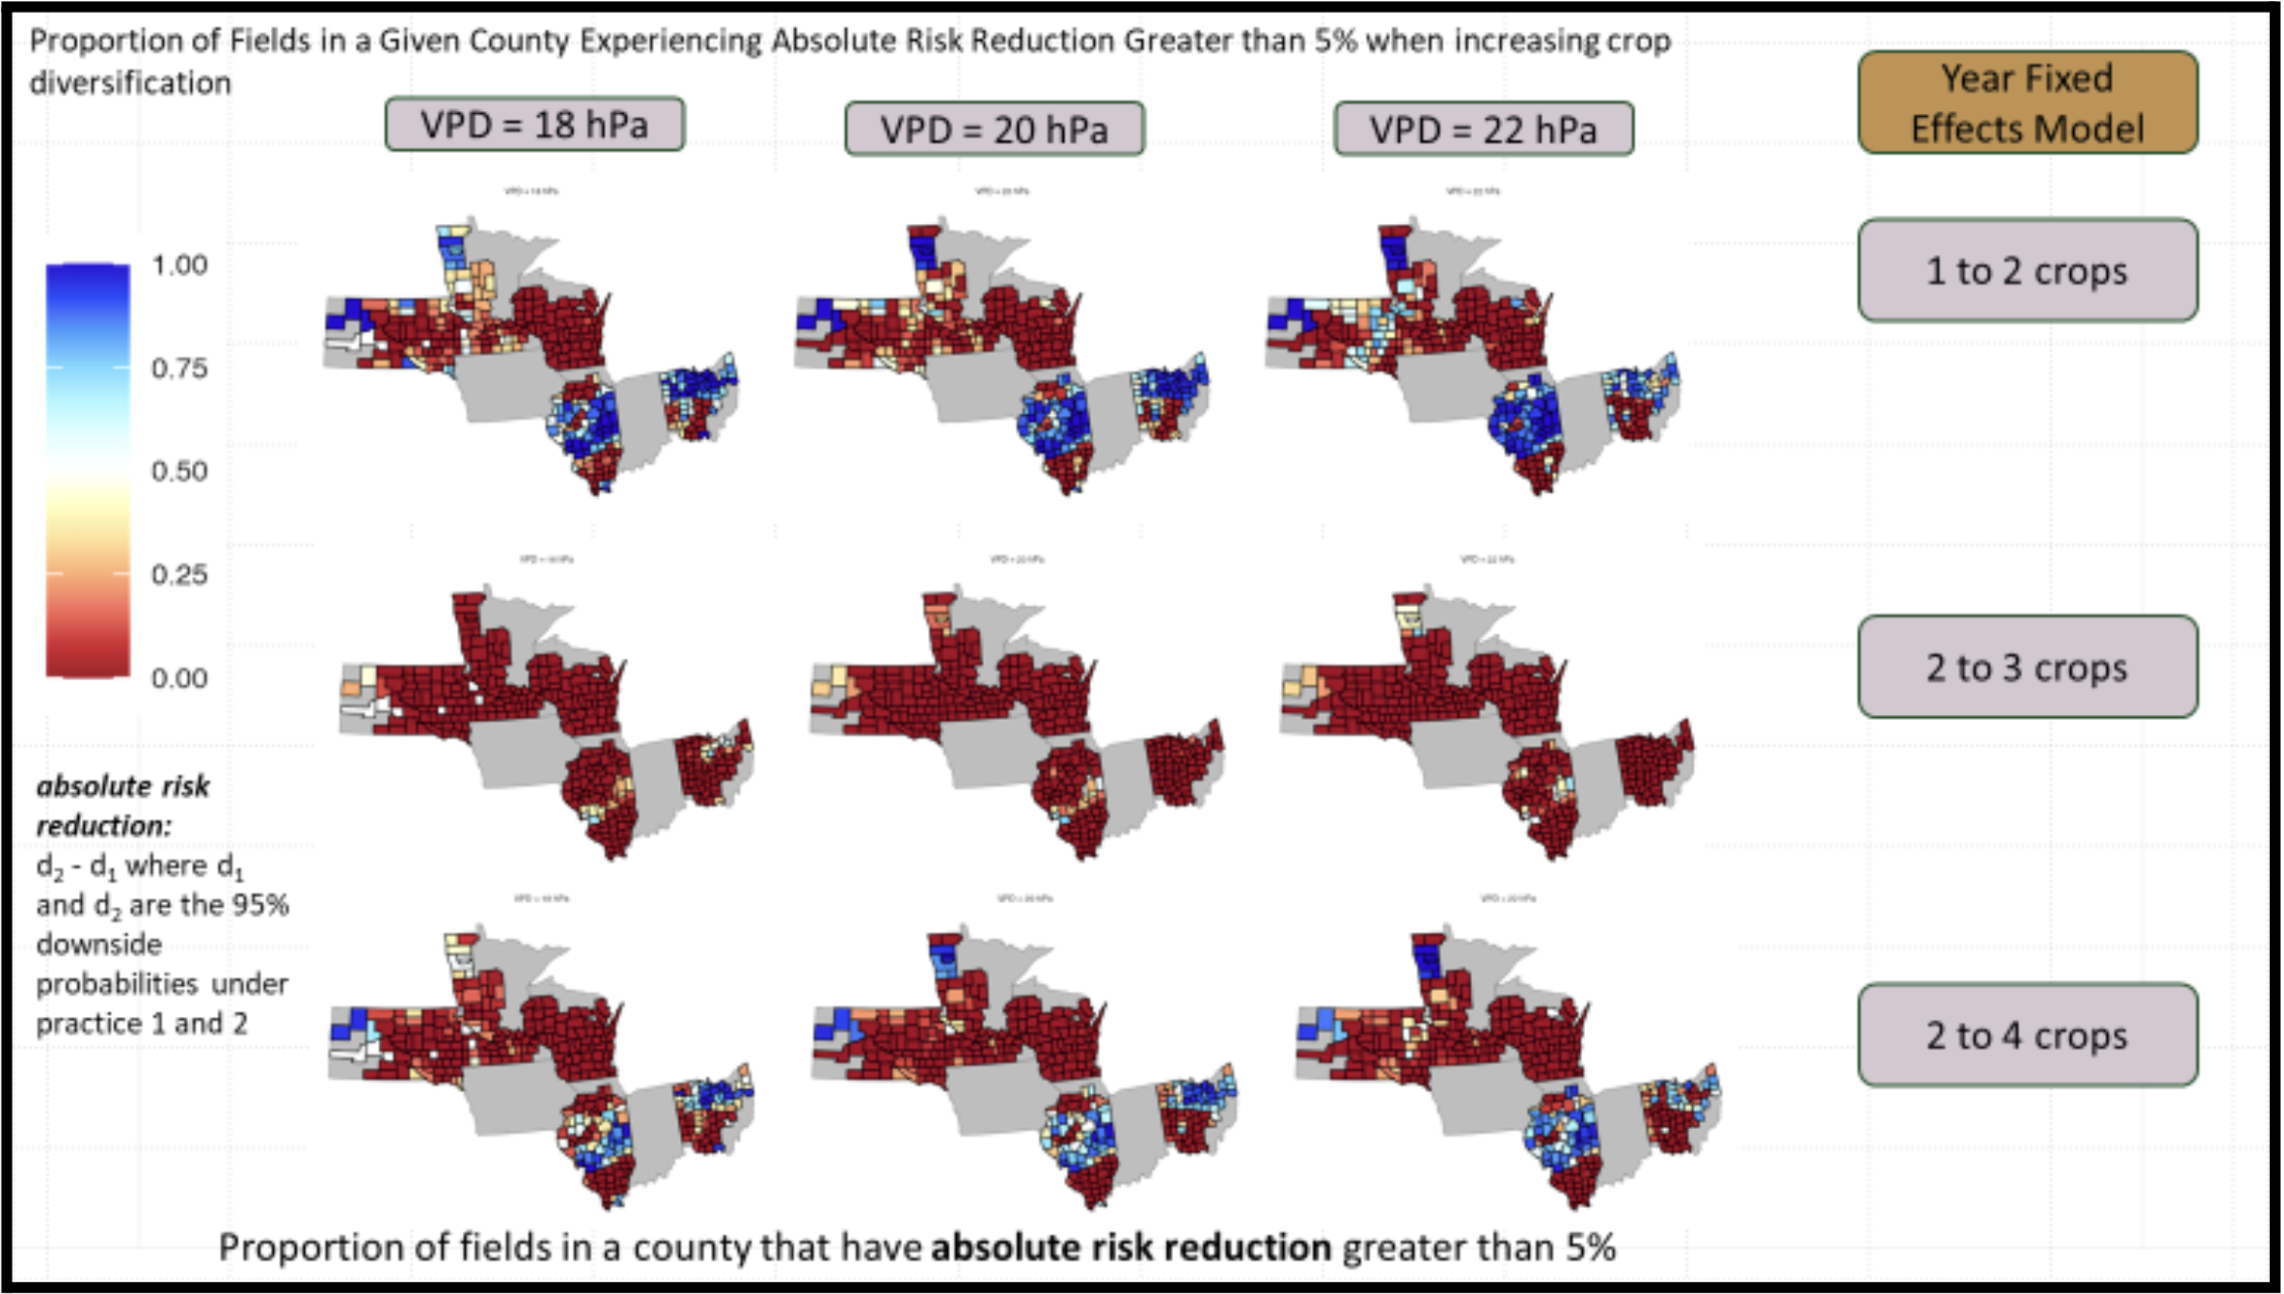
2. Looking at typical outcomes, most farmers in many Illinois counties will reduce their risk by more than 5%, and in several counties, most farmers will see reductions above 10%.
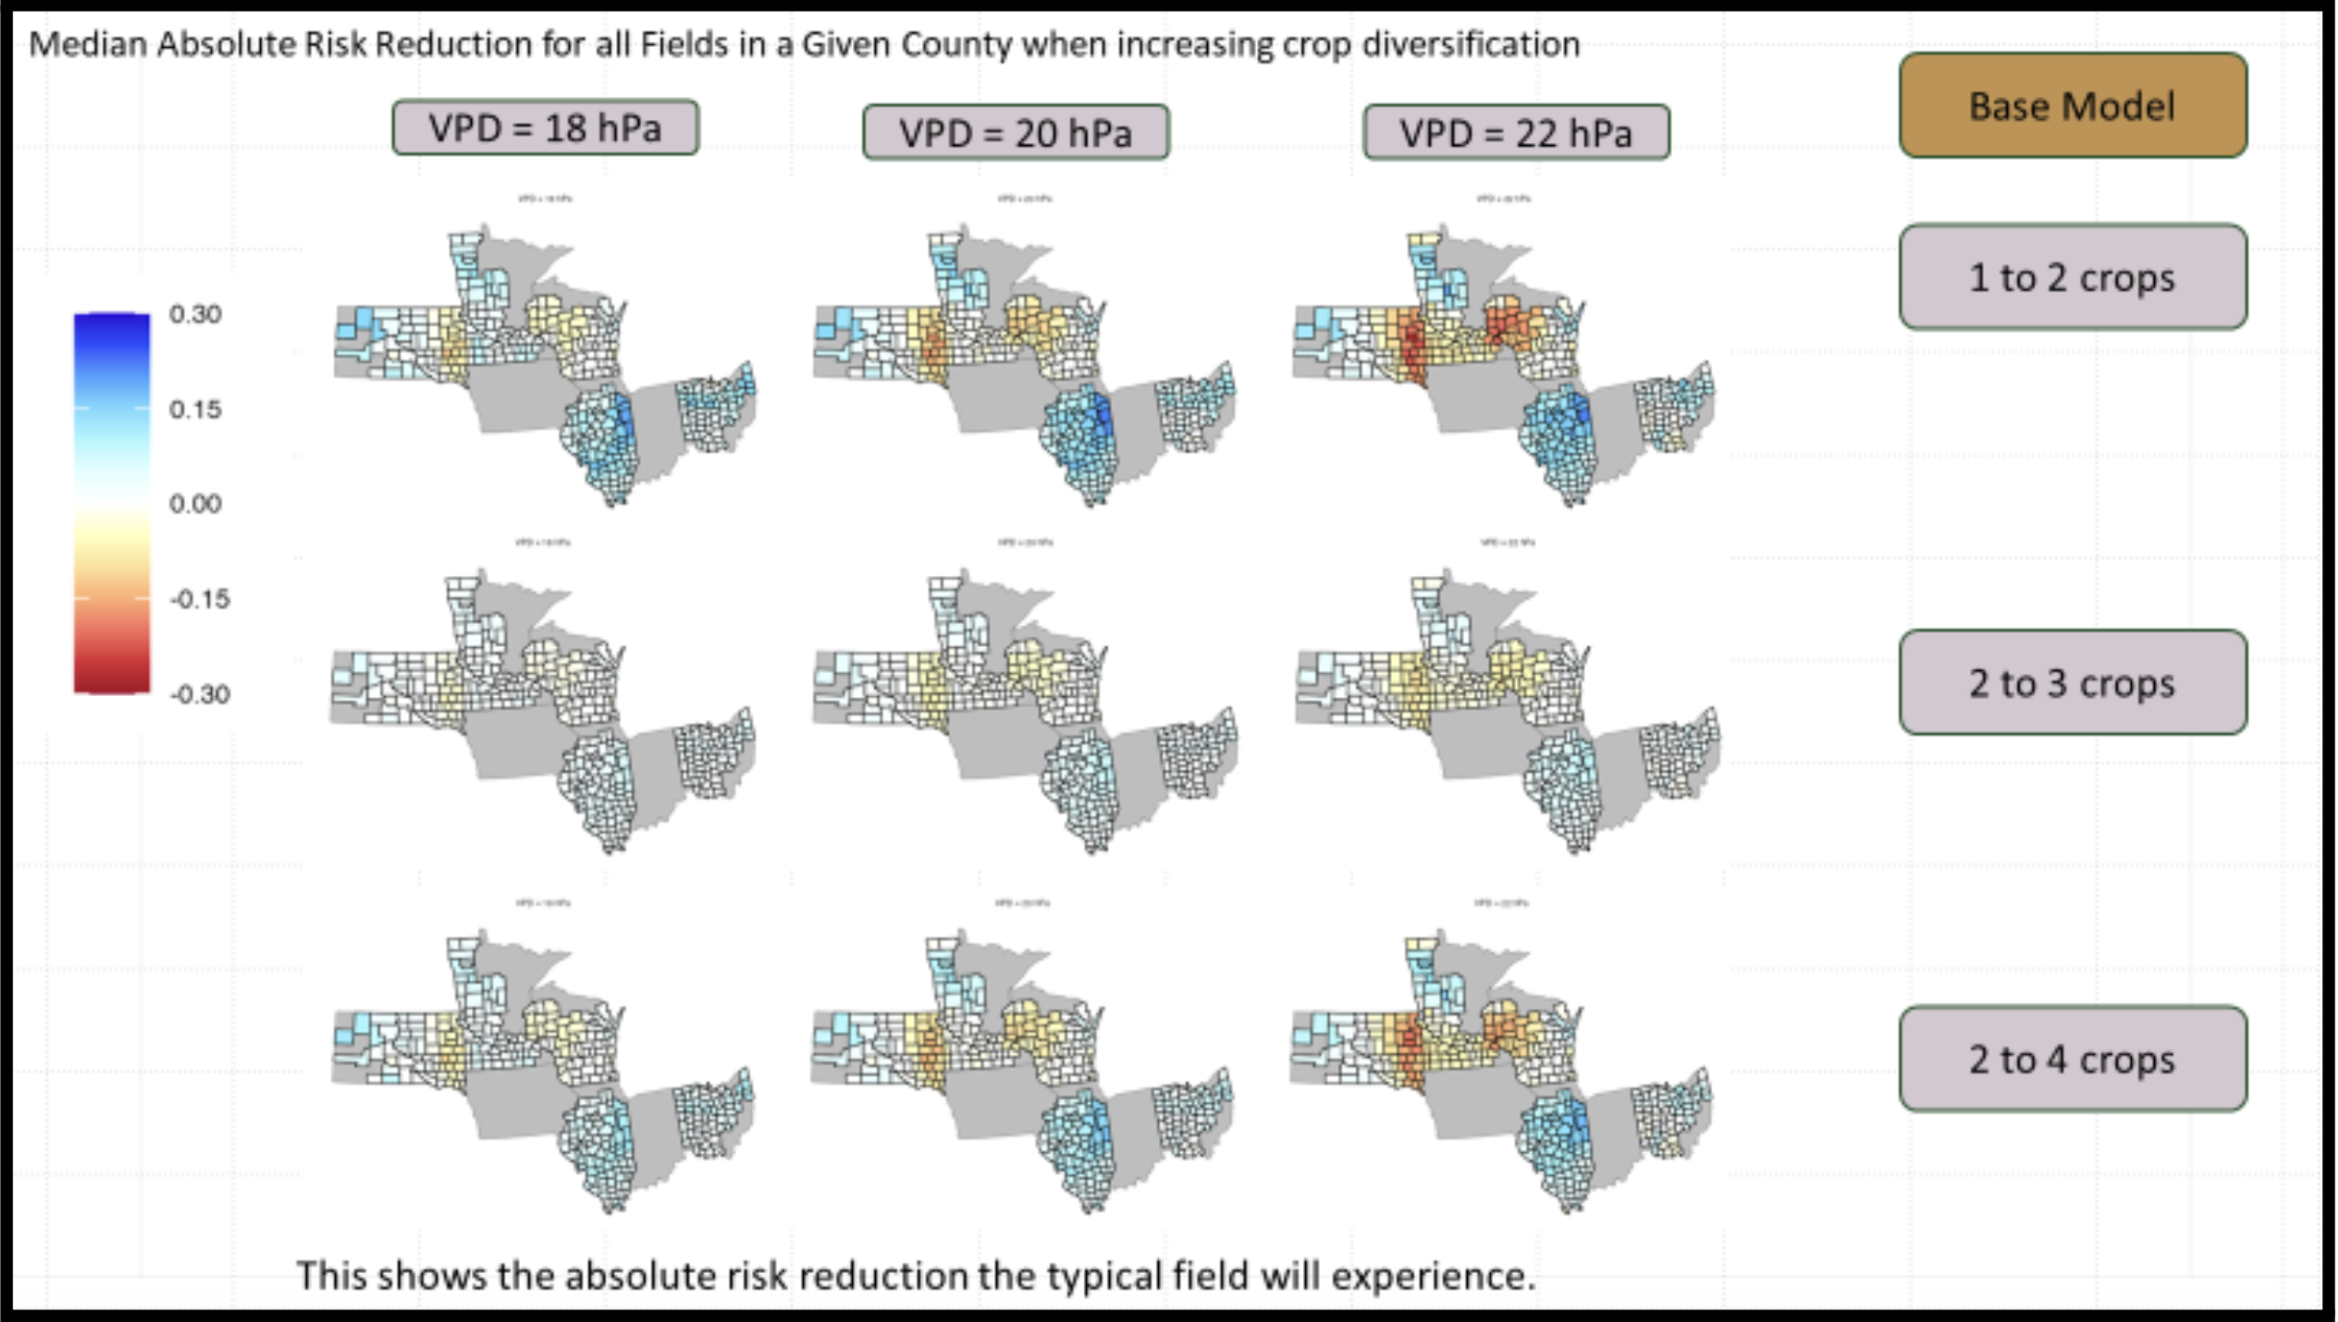
Very light blue (nearly white) = 5% risk reduction. Counties this color or darker have over half their fields achieving at least 5% reduction, which is a strong result.
In our four-state study area beyond Illinois, there is a significant number of counties where the risk reduction reaches 5% for significantly more than half of farmers (fields) in those counties; this number of farmers (fields) is a clear majority in some regions, like northern Minnesota, northern Ohio, and parts of South Dakota.
Light blue = 10% risk reduction. Counties this color or darker have over half their fields achieving at least a 10% reduction, which is a notable level of risk reduction for farmers.
What These Numbers Mean: These percentages represent absolute reductions in downside probability. Downside probability is the likelihood (chance) that a negative outcome could occur, specifically, that a value will fall below a certain threshold. For this research, this represents the probability that a farmer's crop yield will drop below a target level (such as 95% of their historical average yield).
For example, if a farmer's field has a 35% chance of yields dropping below 95% of the historical average with a 2-crop rotation, a 10% risk reduction would lower that chance to 25%, nearly a one-third relative improvement.
Note: A 35% downside probability is typical across many Illinois fields.
Consistency: These results remain consistent across both modeling approaches (base model and year-fixed-effects model) and all three weather scenarios (measured by VPD, which is Vapor Pressure Deficit and measures the humidity in the air).
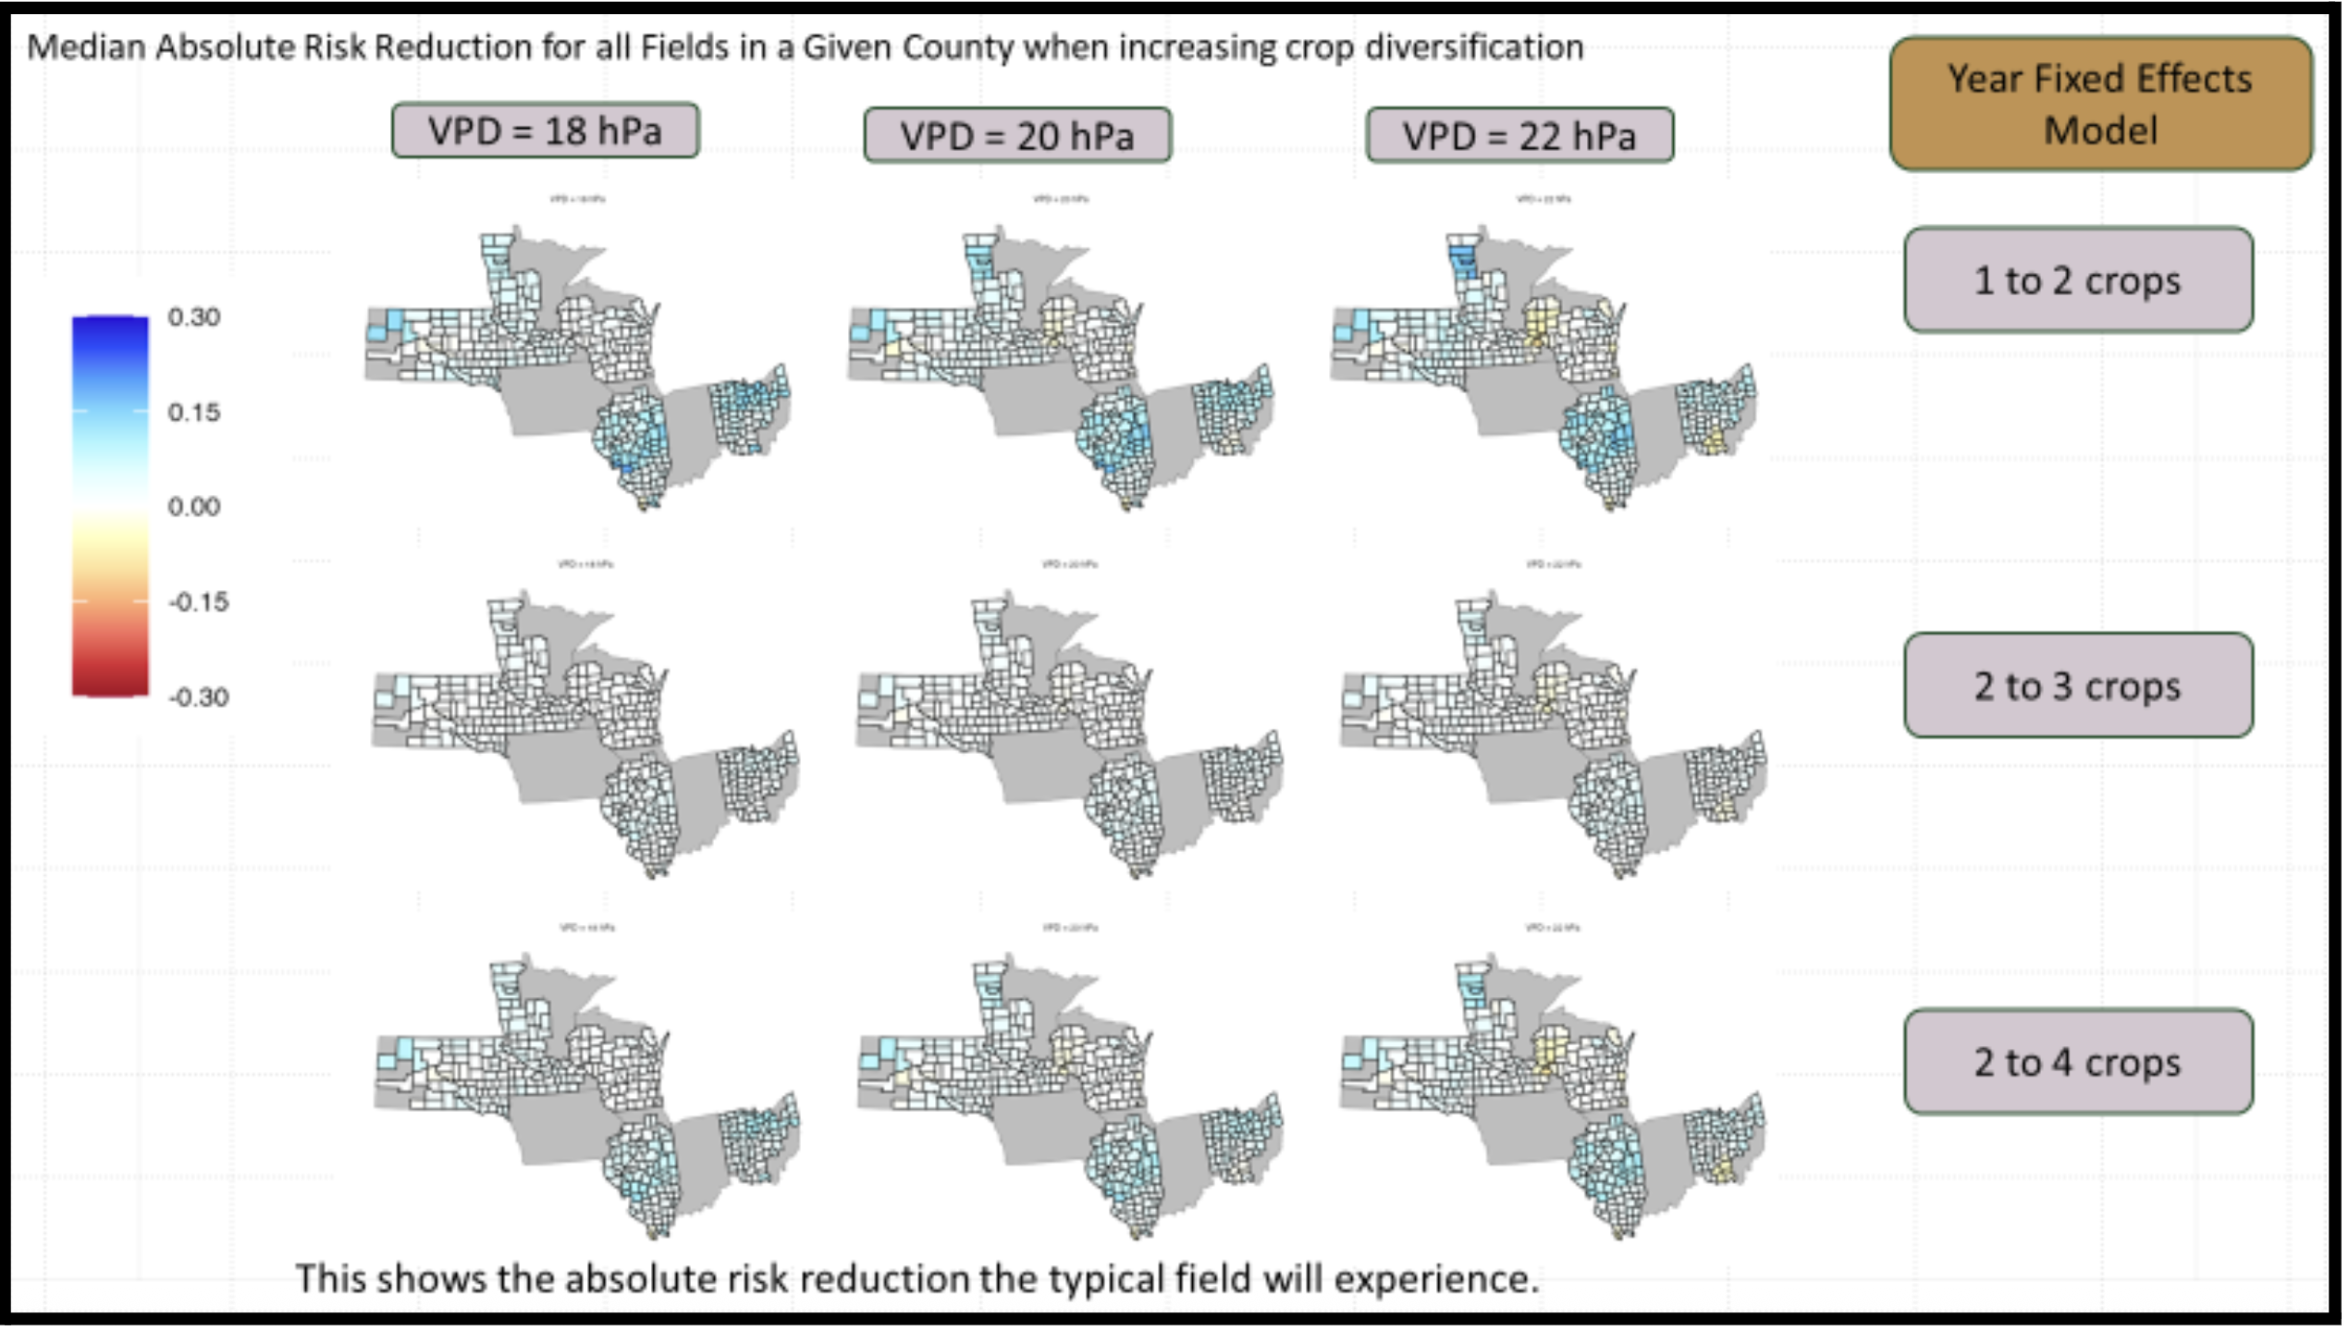
3. While many counties appear dark red on this map, this doesn't mean diversification fails; it simply means risk reduction, though typically positive, is less than 5%.
The 2-to-3 crop transition shows smaller benefits than 1-to-2 or 2-to-4 crop transitions.
Highest risk reduction across the entire study area happens when going from 1 to 2 crops.
When going from 2 to 3 crops and from 2 to 4 crops, in Illinois, Northern Minnesota, Northern Ohio, and a few counties in South Dakota, the amount of risk reduction also exceeds 5% for the vast majority of farmers.
Across the remaining regions, risk reduction remains mostly between 0 and 5%.
Results improve in Northern Ohio and Northwest Minnesota under the VPDMax8 model (not shown), where we know risk reduction at the 5% level is widespread, and VPDMax8 performs best for those regions.
The year-fixed-effects model (second image) shows stronger predictive power. More counties achieve 5% risk reduction for most farmers when predictions are made under conditions similar to a specific past year. This makes sense: by narrowing prediction conditions, we get more favorable outcomes than the base model, which accounts for a broader range of conditions, including some less favorable scenarios.
The choice between models really comes down to a simple question: "Do I think next year will be similar to a specific past year, or could it be more variable?" If farmers expect conditions like a particular historical year, the year-fixed-effects model offers more precise predictions. If they want to plan for a wider range of possibilities, including some they haven't seen before, the base model is more conservative and appropriate. We can frame this as a risk tolerance decision rather than a statistical one, which should make it accessible to growers and policymakers without requiring any quantitative background.
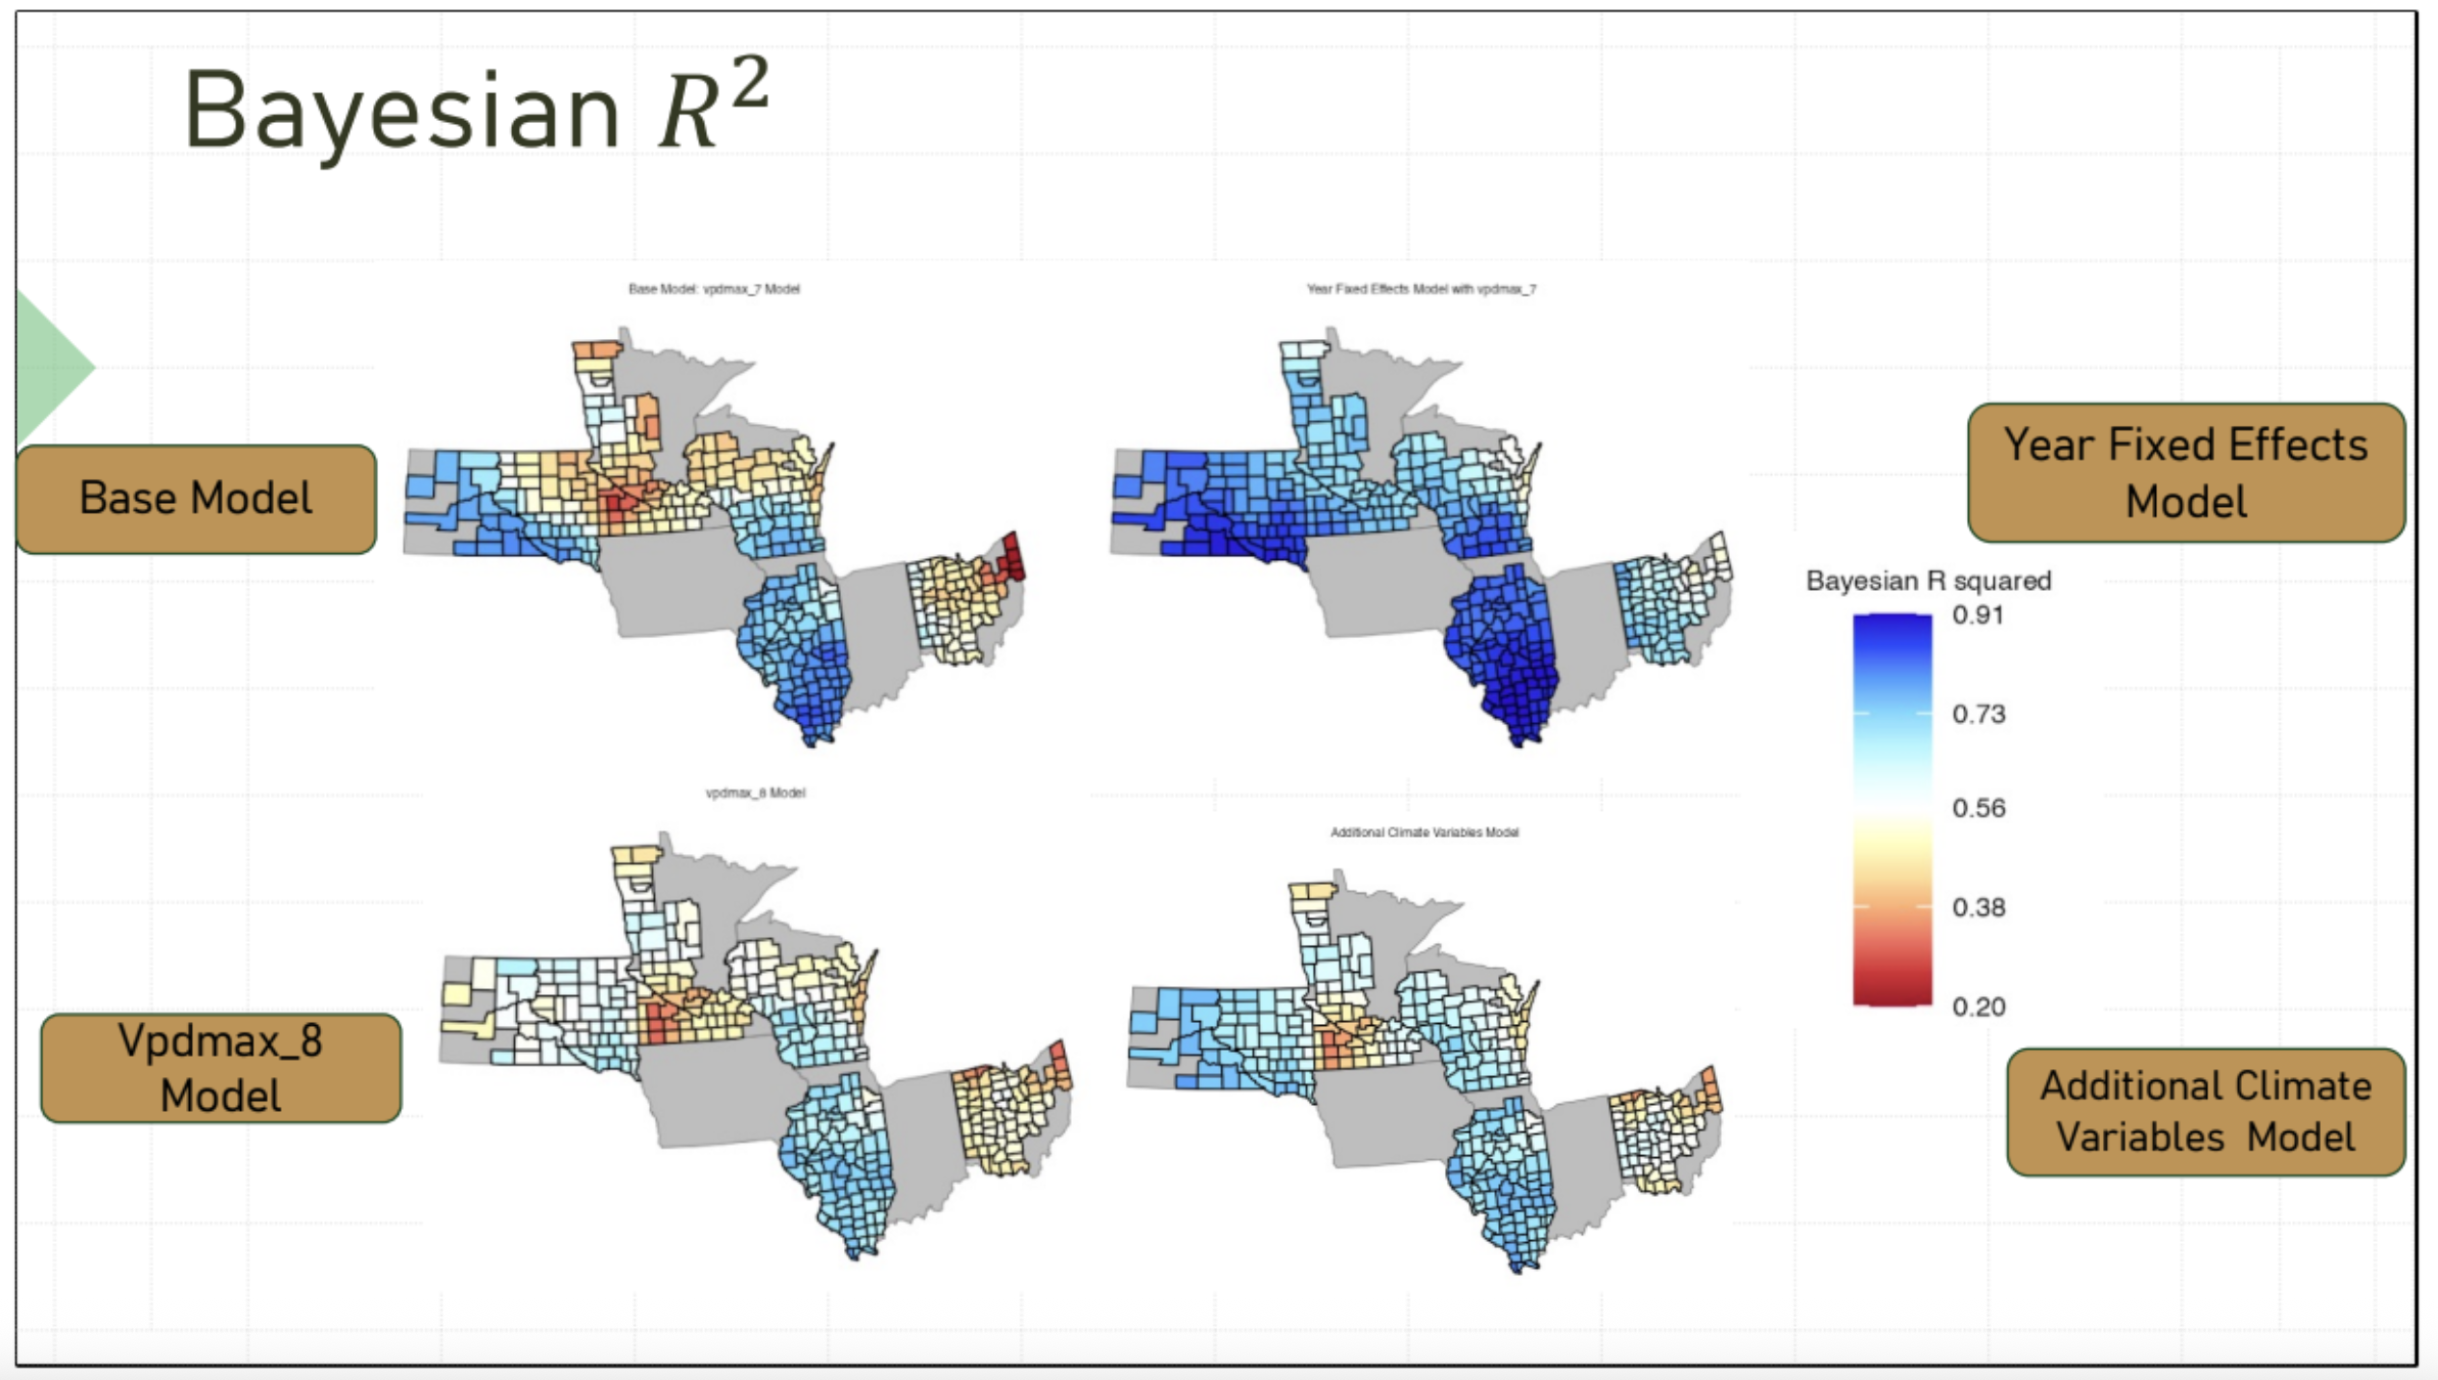
Bayesian R² measures how well each model predicts actual crop yields. Values range from 0 to 1:
Dark blue (0.73-0.91) = excellent predictions
Light blue/white/yellow (0.38-0.73) = moderate predictions
Orange/red (0.20-0.38) = poor predictions
The Four Models:
Base Model (Vpdmax_7): Uses maximum July vapor pressure deficit (VPD) as the primary climate variable with a linear year trend.
Year Fixed Effects Model (with Vpdmax_7): Treats each year as a unique condition rather than a linear trend, requiring users to select a reference year for predictions.
Vpdmax_8 Model: Uses maximum August VPD instead of July, better capturing late-season climate stress in northern regions.
Additional Climate Variables Model: Incorporates multiple climate factors (August VPD, July temperature, and May precipitation) instead of relying on a single variable.
Key Takeaways:
Year Fixed Effects Model has the highest predictive accuracy everywhere (nearly all dark blue).
Base Model works well in most counties, but struggles in parts of Wisconsin and Minnesota.
Vpdmax_8 Model improves predictions in northern forested regions (northern MN, WI, OH).
Gray areas = insufficient data
Why This Matters:
This validation shows which model to trust in different regions. The Year Fixed Effects Model is most accurate, but requires selecting a reference year. The Base Model is simpler and works well across most of the Midwest.
Geographically specific modeling recommendations:
Across most counties in all five states, the Base Model, which uses maximum July VPD as the primary climate variable, provides strong predictions with well-validated uncertainty estimates. A few localized areas in Minnesota, Ohio, and Wisconsin are exceptions where alternative models perform better.
The Year-Fixed Effects (YFE) Model outperforms the Base Model in those challenging areas and delivers strong predictions everywhere. However, as we mentioned, it requires users to select a reference year (2014-2020) as a comparable scenario for making predictions. We'll need to assess whether stakeholders at all levels are comfortable with this approach.
In Northern Minnesota, Northeast Wisconsin, and Northeast Ohio, where planting occurs later and forested land is more prevalent, the Vpdmax_8 Model, which uses maximum August VPD instead of July, performs better than the July version.
This research demonstrates that crop diversification consistently reduces yield risk for the vast majority of Midwest farmers across diverse weather conditions and geographic regions. The modeling framework provides critical evidence that soil health practices deliver measurable risk-mitigation benefits without sacrificing crop performance, offering valuable insights for farmers, insurers, and policymakers working to build more resilient agricultural systems.
Our research also examines how soil health practices affect farm economics and profitability, findings we'll explore in a future post.
These findings will be added to our risk modeling tool in the coming months.
We also extend our gratitude to Dr. Frederi Viens of Rice University, the Land Core Risk Model project’s Statistics Co-Principal Investigator, for his leadership of the statistical modeling team and for this summary of Dr. Pizzo’s findings.
See more of our recent findings and press related to the project here. If you’re interested in learning more about Land Core’s risk modeling work, please feel free to reach out to lily@landcore.org.