
Risk Mitigation Benefits of Soil Health Practices: Recent Revenue Risk Findings from the Heart of the Corn Belt
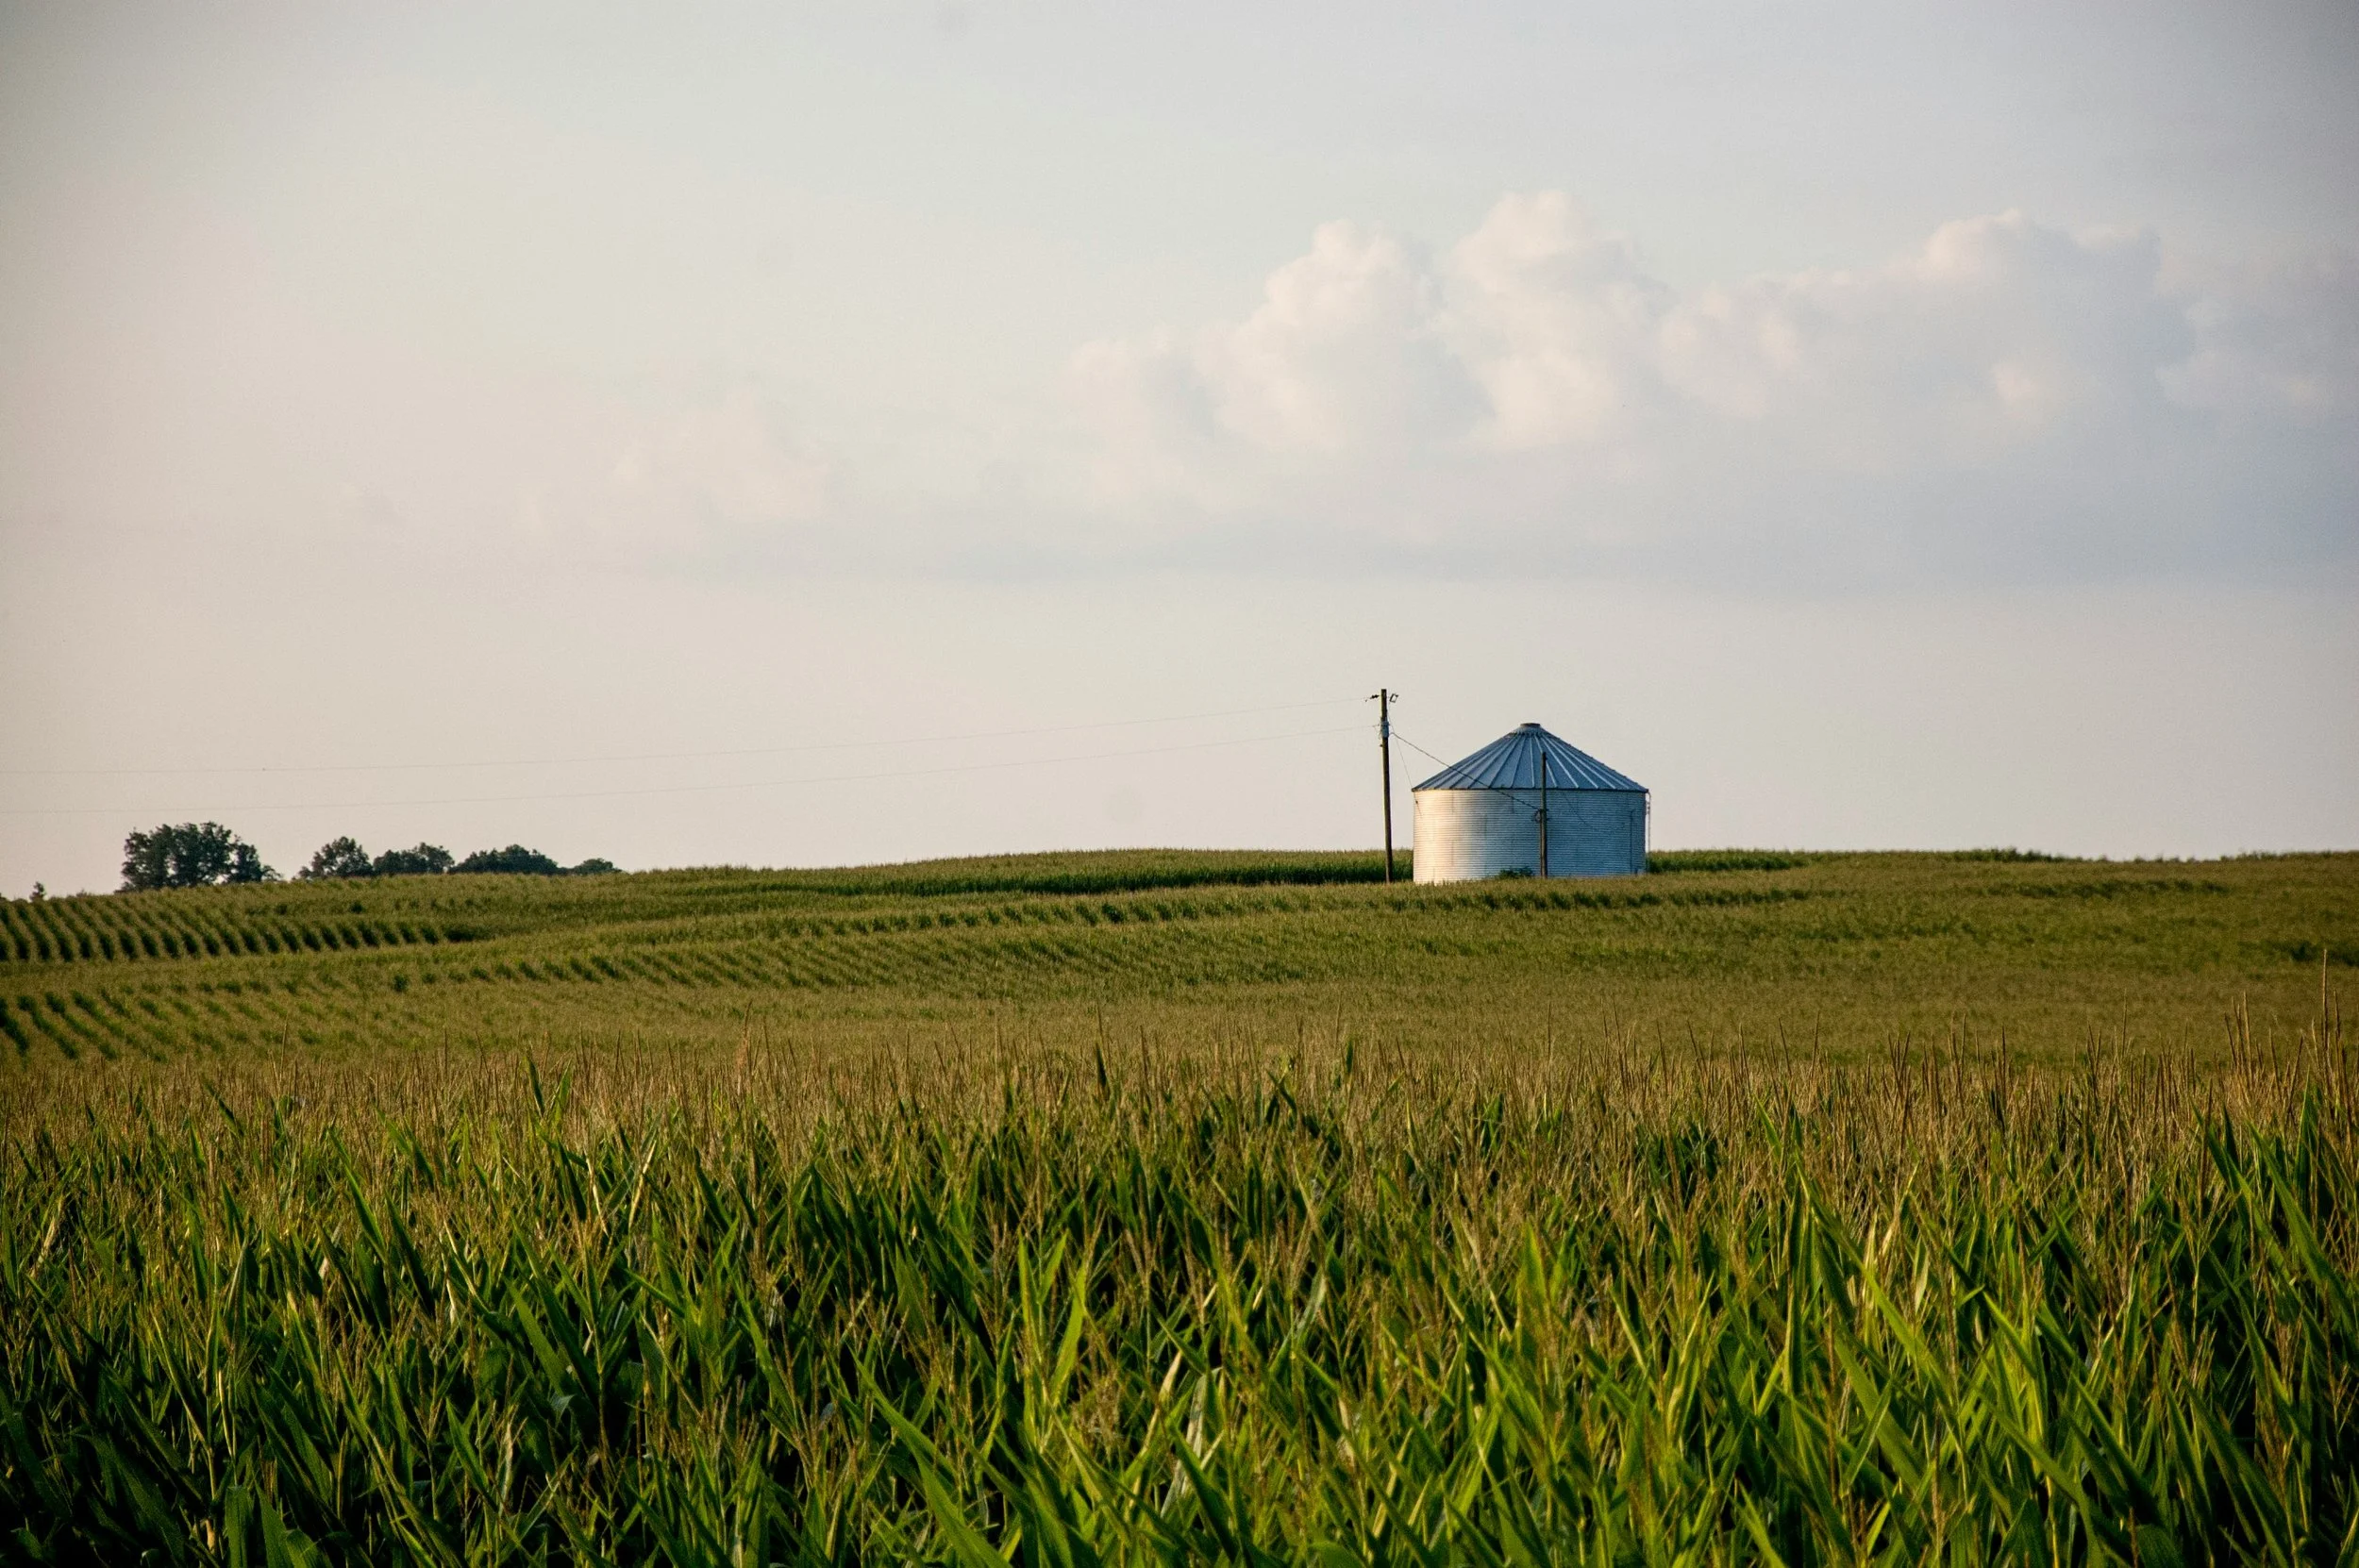
Image taken by Joshua Michaels on Unsplash+.
Summary of Results from Chapter #2 of Dr. Gina Pizzo’s Dissertation
In agriculture, financial survival depends not simply on harvest size, but on revenue: what a field produces, multiplied by what the market will actually pay for it. These two forces do not move independently, and in most Midwest counties, when local harvests are poor and supply tightens, prices tend to rise, offering farmers a partial natural cushion. Even so, commodity price swings contribute roughly three to four times more uncertainty to farm revenue than yield variability does, meaning that market risk, not weather, is the dominant threat to a farm's bottom line.
This study evaluates farm revenue risk from two complementary perspectives: the individual farmer, whose exposure is shaped by local grain prices and their own fields' productivity, and the farm lender or insurer, who must account for variability across an entire county. Against that backdrop, the central question is whether the agronomic benefits of diversified crop rotations translate into a meaningful financial benefit, meaningful financial risk reduction, and/or no harm to the bottom line, once the scale of price uncertainty is fully accounted for.
The findings below indicate that they do: transitioning from a two-crop to a three-crop rotation consistently maintained or modestly improved mean corn revenue across farm sizes and the majority of counties studied, while also reducing farmers' vulnerability during periods of yield losses, whether they are cushioned by negative price-yield correlation, or whether they coincide with price weakness.
1. The Mechanics of Revenue Risk
Our research differentiates between two critical perspectives on uncertainty:
Reporting Scenario A (The Farmer): Focuses on the performance of a specific field or farm. It assumes rational inattention, where a farmer focuses on local elevator bids (spot prices) rather than complex national dynamics and correlations. To enhance the reliance on rational inattention, the study relies on the assumption that the farmer sells all of their crop once per year. A further analysis of how a farmer may optimize spreading out the sale of their crop over the entire fall and early winter season is underway.
Reporting Scenario B (The Farm Lender/Insurer): Aggregates risk across entire counties. This perspective accounts for price-yield correlation, recognizing that in many Illinois counties, when local yields are low, scarcity drives prices higher, creating a natural hedge for farmers on the aggregate. The perspective adds a source of uncertainty which permeates any farm lender’s business, though not an individual farm’s: farms across an entire county vary in important characteristics influencing yields, such as soil quality and the like, and an individual farmer knows their fields’ potential productivity. This unbalanced uncertainty implies that farm revenue risk is higher for, say, a farm lender working with clients across a county than for each individual farm operation.
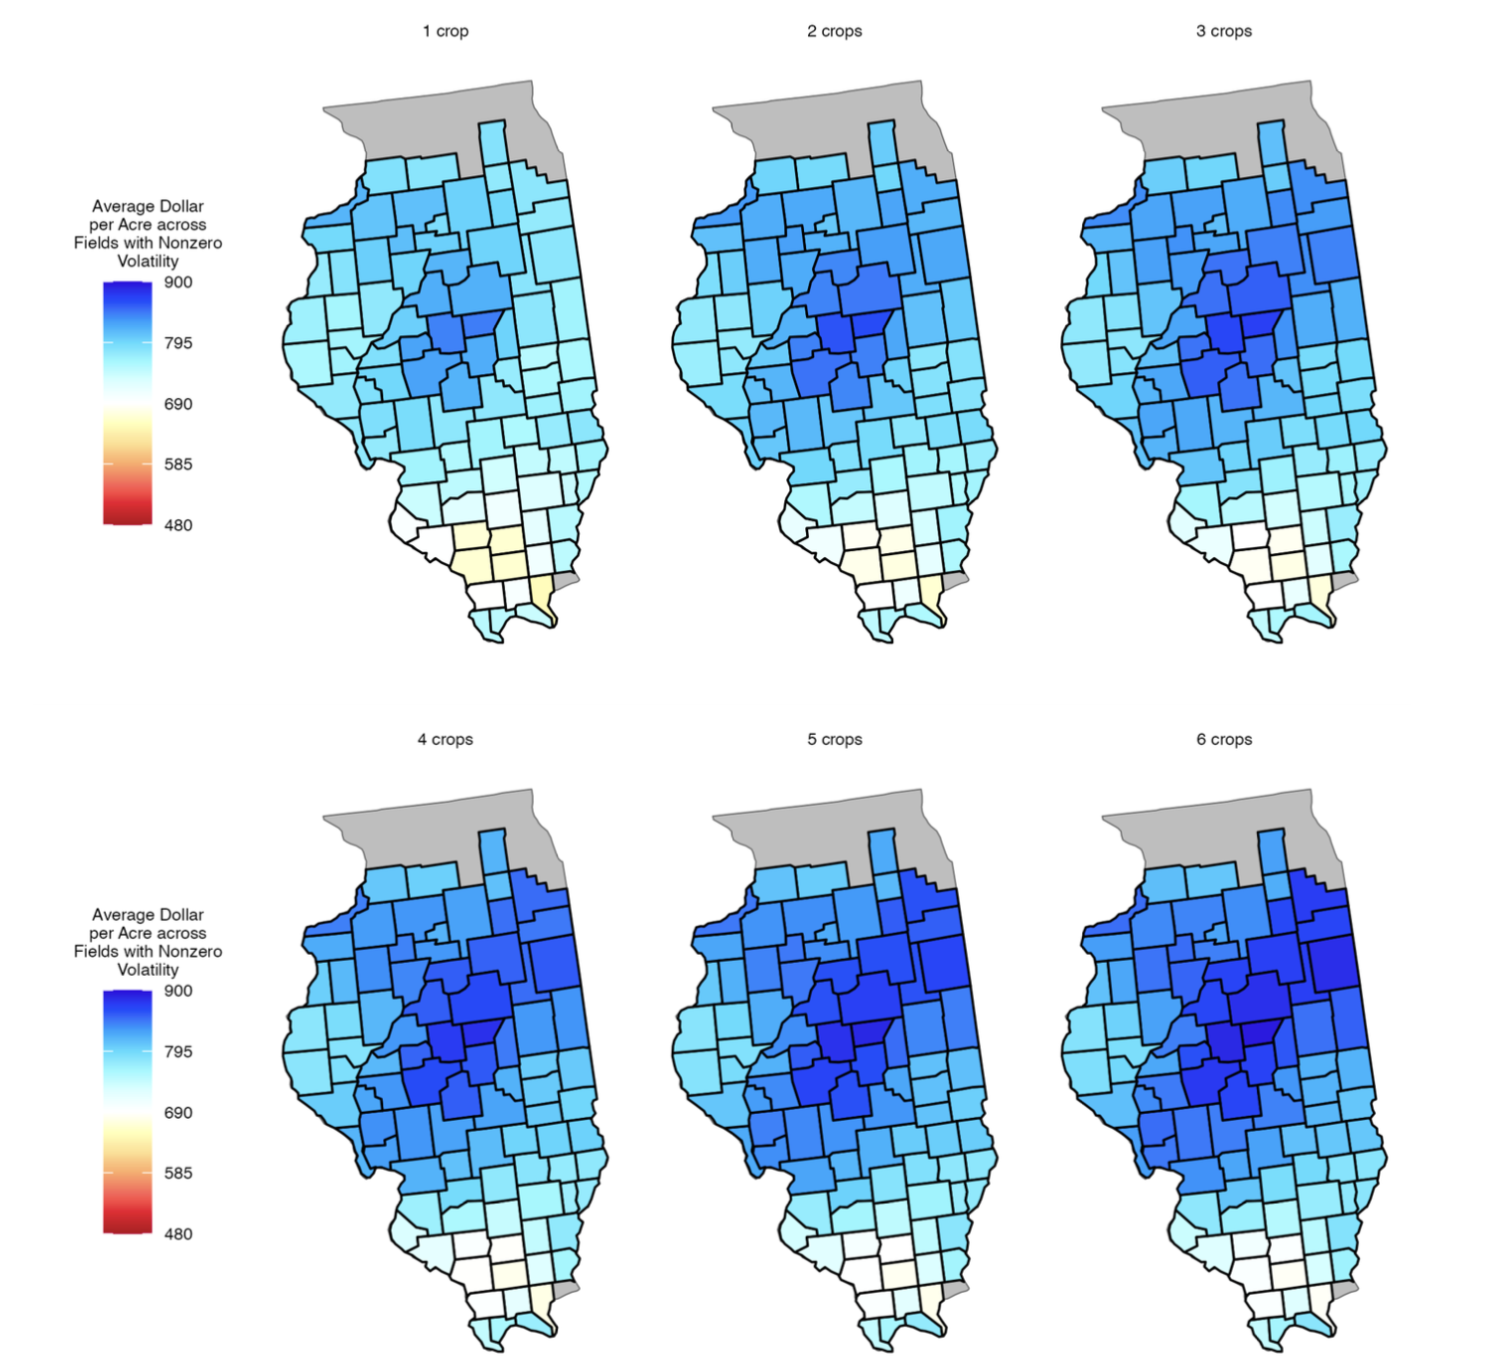
Figure #1: Maps of Average Dollar per Acre Across Fields for Model 2 (With Price-Yield Correlation) With Nonzero Volatility. These maps illustrate the posterior mean revenue for corn when accounting for both market volatility and the realistic negative correlation between price and yield. While the benefit of increasing rotational complexity (moving from one-crop to six-crop scenarios) remains evident in high-productivity regions—specifically the central, central-western, and northeastern sections—the "natural hedge" of price-yield correlation subtly smooths the revenue upside. In regions with more variable yields, such as Southern Illinois, the negative correlation provides a floor by enhancing revenue during yield downside events.
2. Modeling Market Volatility
Agricultural prices are seasonal and mean-reverting, meaning they do not follow a simple bell curve. The study employs a log-normal distribution to model one-year price horizons. We use the log-normal model because it is the industry standard for commodities. It respects the fact that corn prices can't go below zero, captures the potential for sudden market spikes, and allows us to provide a high-fidelity risk profile that a bank or insurer would find mathematically credible. This framework was already adopted for commodities in the so-called Black ‘76 Framework and related works*. By setting volatility at a level consistent with national corn futures, the model captures the right-hand skew of the market, where price spikes beyond those of a bell curve distribution are possible but relatively rare, and most outcomes cluster around the mean.
* This log-normal framework was introduced in the late 1960s by Robert Merton for ordinary stock markets, and was taken up in the context of commodities spot and futures prices, for instance by Fisher Black in 1976; see blogpost: https://www.investopedia.com/terms/b/blacksmodel.asp for more information.
Key Findings: Scale and Resilience
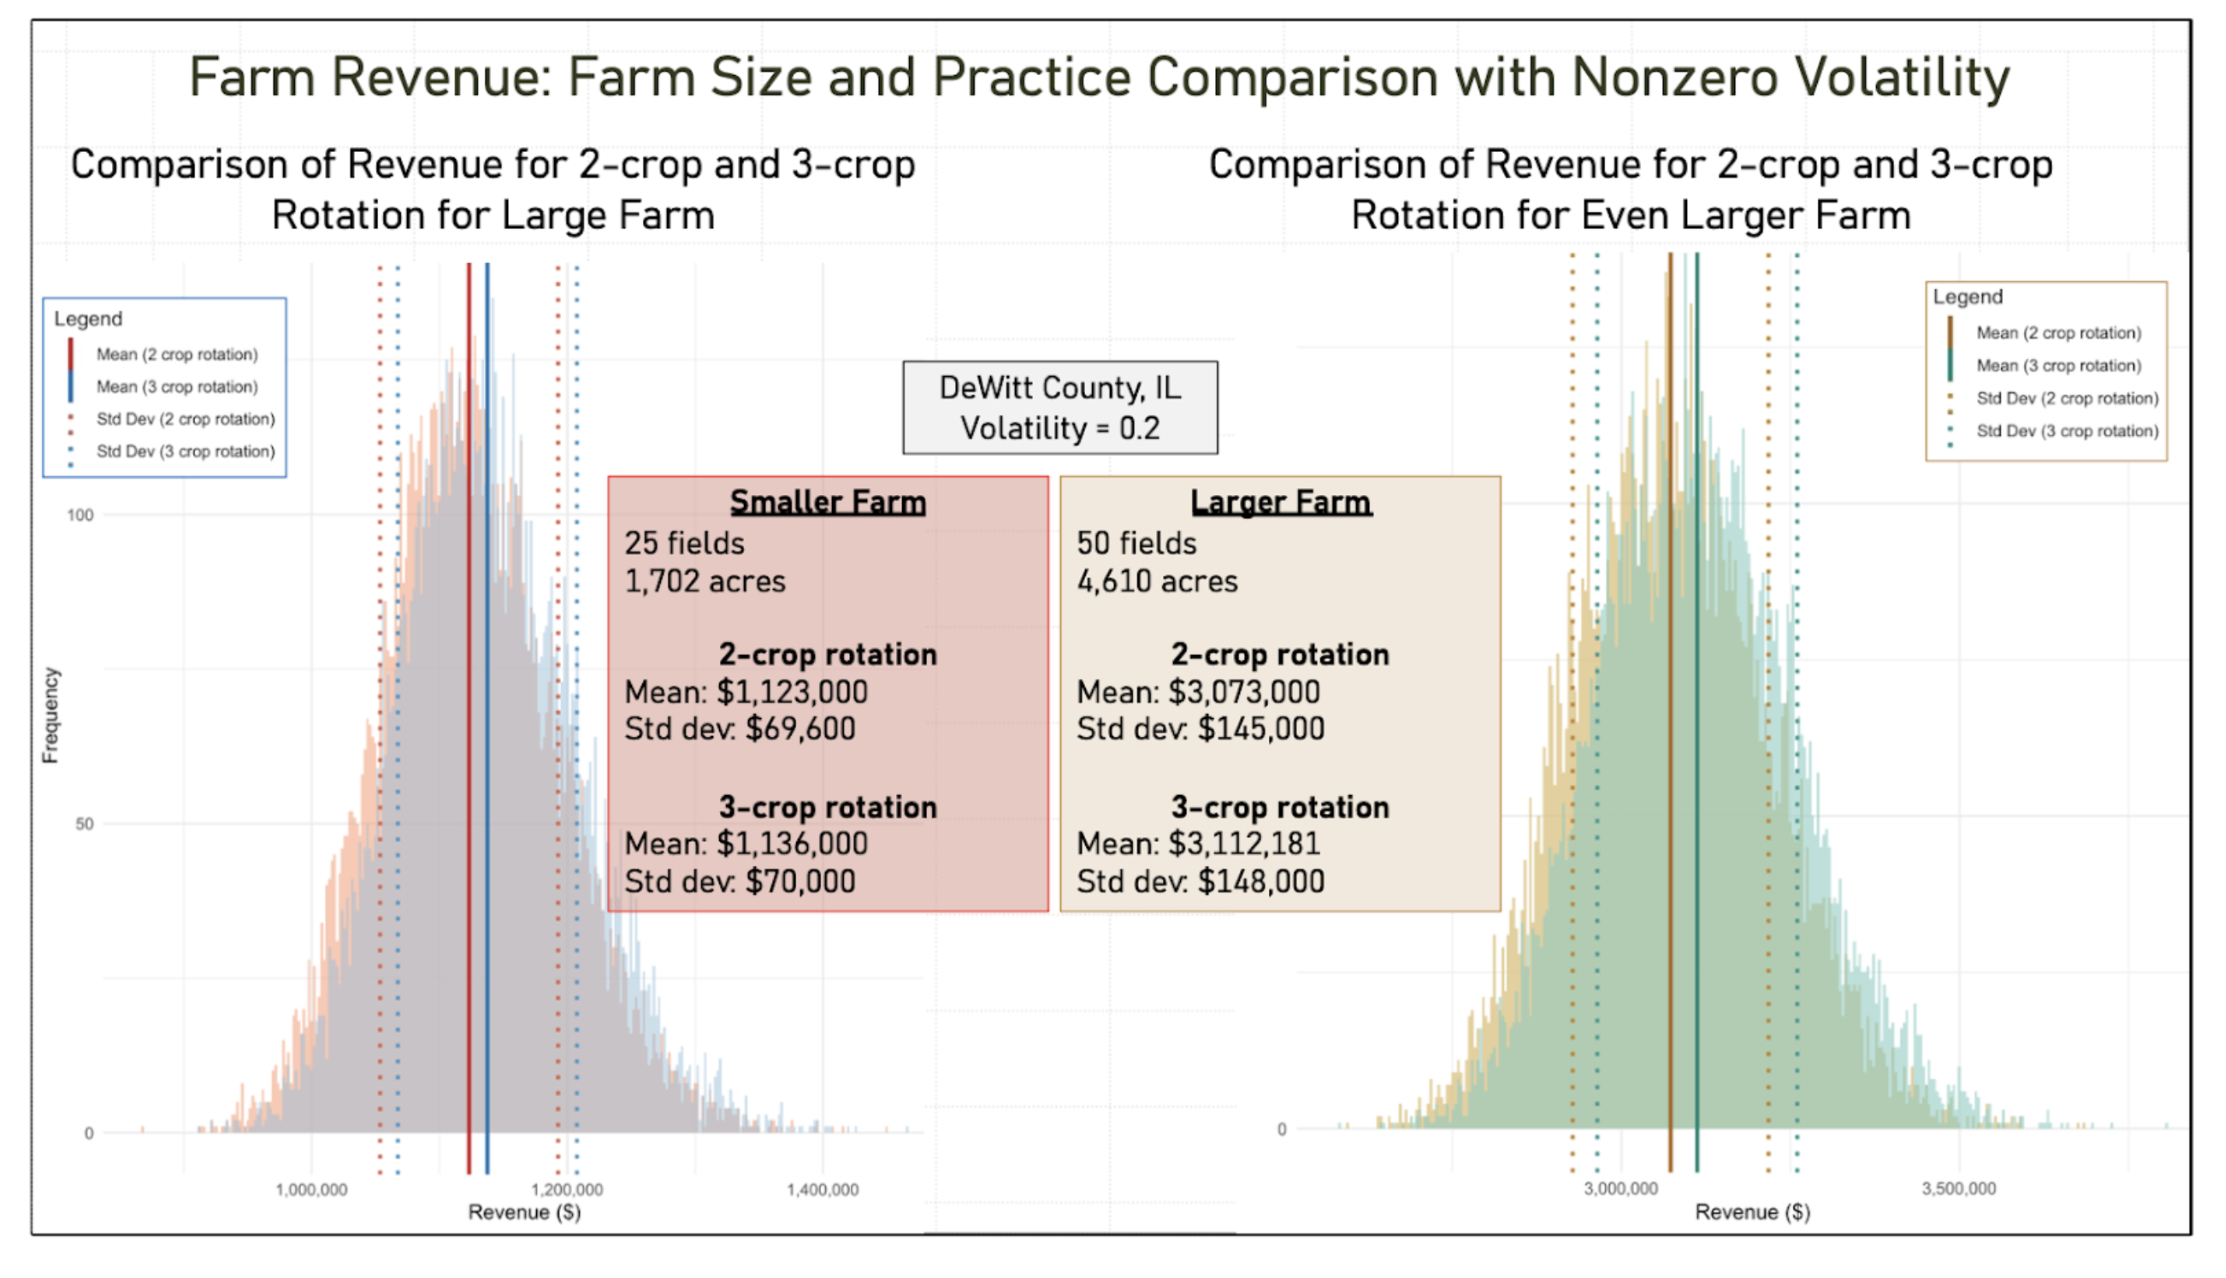
Figure #2: Comparison of Revenue for 2-Crop + 3-Crop Rotations for a Large Farm vs. Even Larger Farm With Nonzero Volatility. A critical takeaway for the farming community and its financial partners is the comparison between different scales of farm operations. In the above figure, while a Medium-Large Farm (just under 2000 acres spread across 25 fields) demonstrates significant stabilization of its revenue, with mean around $1 million, compared to individual fields where the uncertainty level per acre would be 4-5x higher, the Very Large Farm (on the right hand side of the figure, with nearly 5000 acres spread across 50 fields) scales these efficiencies to a total revenue mean of over $3 million, with an uncertainty level per acre around 8-10x higher at the field level.
Most importantly, the aforementioned revenue model transitions from the specific "downside risk" focus of our yield risk modeling and findings to an aggregate economic view of the entire revenue distribution. This holistic view confirms that no harm is done by moving from a two-crop to a three-crop rotation; instead, increasing rotational complexity (RCI) maintains financial performance while providing the underlying agronomic stability necessary for long-term resilience. This is visible in the above figure by focusing for instance on the solid and dotted red vertical lines, which correspond to mean revenue dollars and their uncertainty band, for two crops in rotation, and the similar blue vertical lines for three crops in rotation, which are shifted to the right of the red lines, indicating a modest but visible improvement to corn revenues with three crops in rotation compared to only two crops in rotation.
A. The Power of Farm-level Diversification
Using synthetic farms (collections of 25 to 50 fields located in close proximity to each other), our research quantifies how spatial diversification reduces risk.
The "Portfolio Effect": Scaling from a single field to 25 fields (in the example given here, which constitutes a typical large farm for Illinois with about 1,700 acres of corn) reduced the standard deviation of revenue by a factor of four. This risk reduction factor reaches about eight to ten for a very large farm with 4,600 acres of planted corn in 50 fields.
This portfolio effect refers to diversification of fields and their associated productivity levels, not diversification of crops, since our study considers corn production and corn prices exclusively.
See Figure #2 above.
The Yield-Price Uncertainty Ratio: In a typical Illinois scenario, price uncertainty contributes roughly three times more to revenue standard deviation than yield uncertainty.
This takes price-yield correlation into account, which offers farmers a natural hedge because it is typically negative.
This study recognizes empirically that this natural hedge is present in the vast majority of Illinois counties, though not all of them.
This study is strongly consistent with the notion that commodity price risk will often dominate a farm operation’s bottom line far more than yield risk, a phenomenon which the aforementioned natural hedge accentuates, while yield risk at the farm level is most often tied to weather risk, according to our prior yield risk findings.
See Table #1 below.
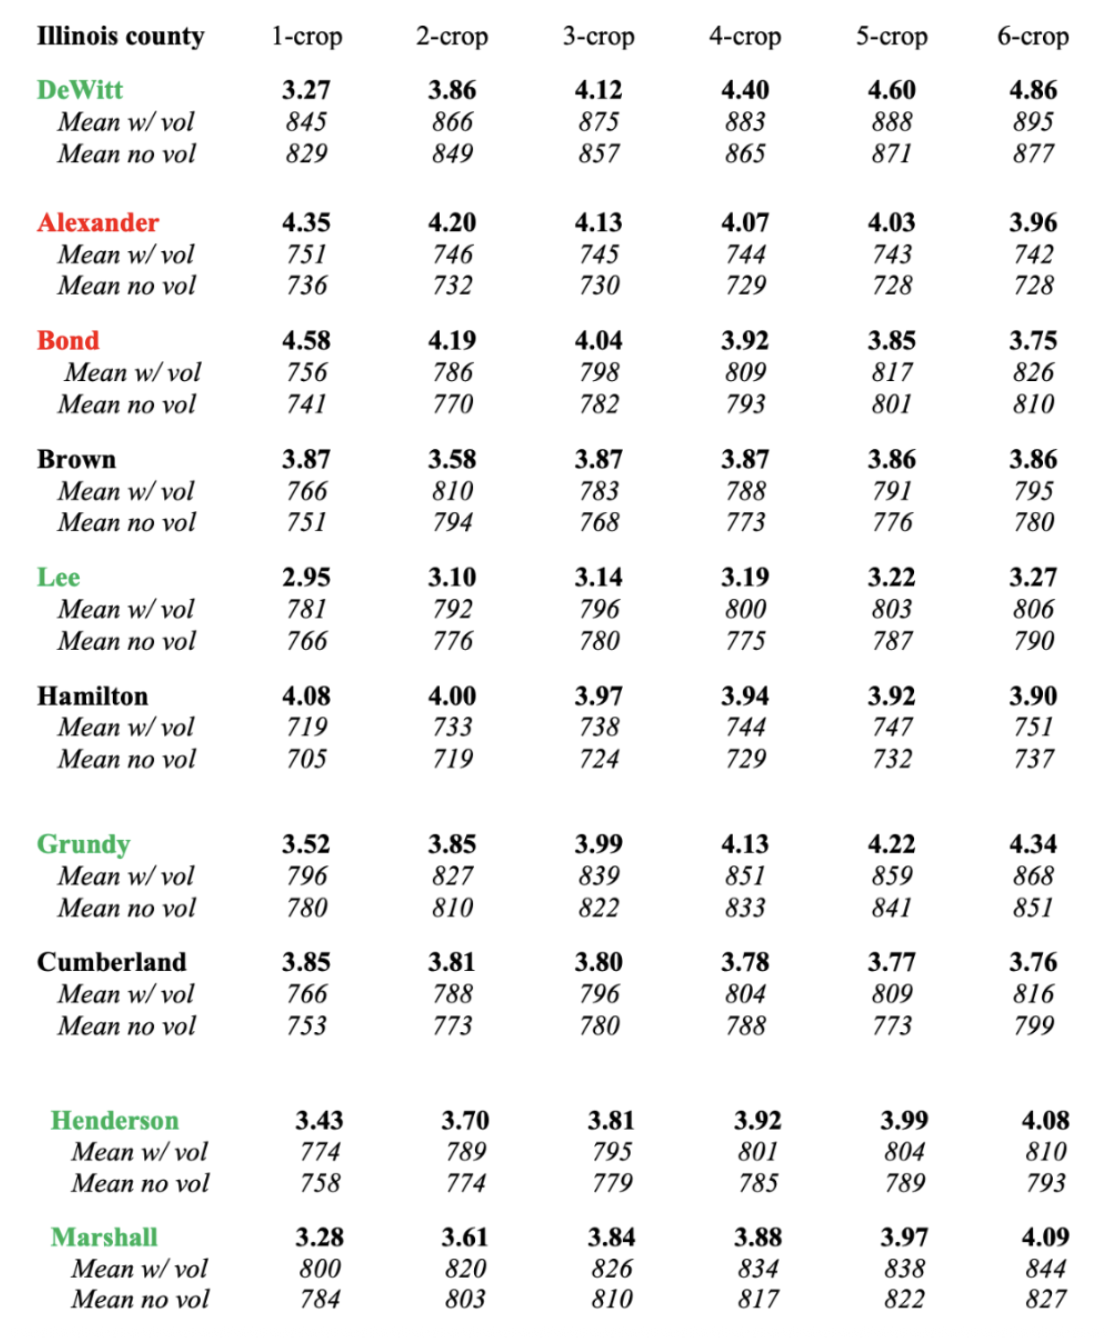
Table #1: Yield-Price Uncertainty Standard Deviation Ratios (Unconditional, County-Level Aggregate) for 10 Selected Illinois Counties, per Number of Crops in Rotation, With County-Mean Dollars per Acre in Each Case. This table is for the realistic model (price-yield correlation included). The green color in the county names indicates the counties where the ratio increases with the number of crops in rotation, the black color indicates those counties where that ratio is largely constant across crop rotation number, and the red color indicates the counties where the ratio decreases. The dollar-per-acre means show the slight but consistent increase in mean revenue in 9 out of 10 counties. The larger yield-price uncertainty ratios for higher rotational complexity are a translation of the stabilization of yield risk with the higher RCI, since price risk remains unchanged.
B. Soil Health vs. Market Noise
A primary question: Does the benefit of a 3-crop rotation get drowned out by price swings?
The "Do No Harm" Result: Transitioning from a two-crop (corn-soy) to a three-crop rotation (adding wheat/small grains) consistently increased mean revenue across all farm sizes, even if slightly so in most cases.
Stabilization: While price volatility is the dominant force, according to our prior yield risk results, higher rotational complexity (RCI) acts as a financial floor. It reduces yield-driven uncertainty on the downside, ensuring that when prices are low, the farmer isn't hit as frequently by the compounded stress of low yields and prices.
C. The State-Wide "Risk Map"
The study mapped standard deviation ratios to determine how much price volatility increases a county's revenue risk. In both the naive and realistic models, the underlying price volatility is fixed at the national futures benchmark of 20% per annum, making this a fair comparison when contrasting whether correlation is included.
Uncorrelated (Naive) Model: Revenue risk is roughly 2x yield risk.
Correlated (Realistic) Model: Revenue risk is 3x to 4x yield risk — meaning that price variability contributes far more to revenue uncertainty than yield variability does. This finding underscores that farmers' risk exposure is driven primarily by commodities market volatility, and only secondarily by fluctuations in yield.
Geographic Robustness: In a majority of Illinois counties, increasing rotational complexity either stabilized or reduced this ratio, even under intense price volatility.
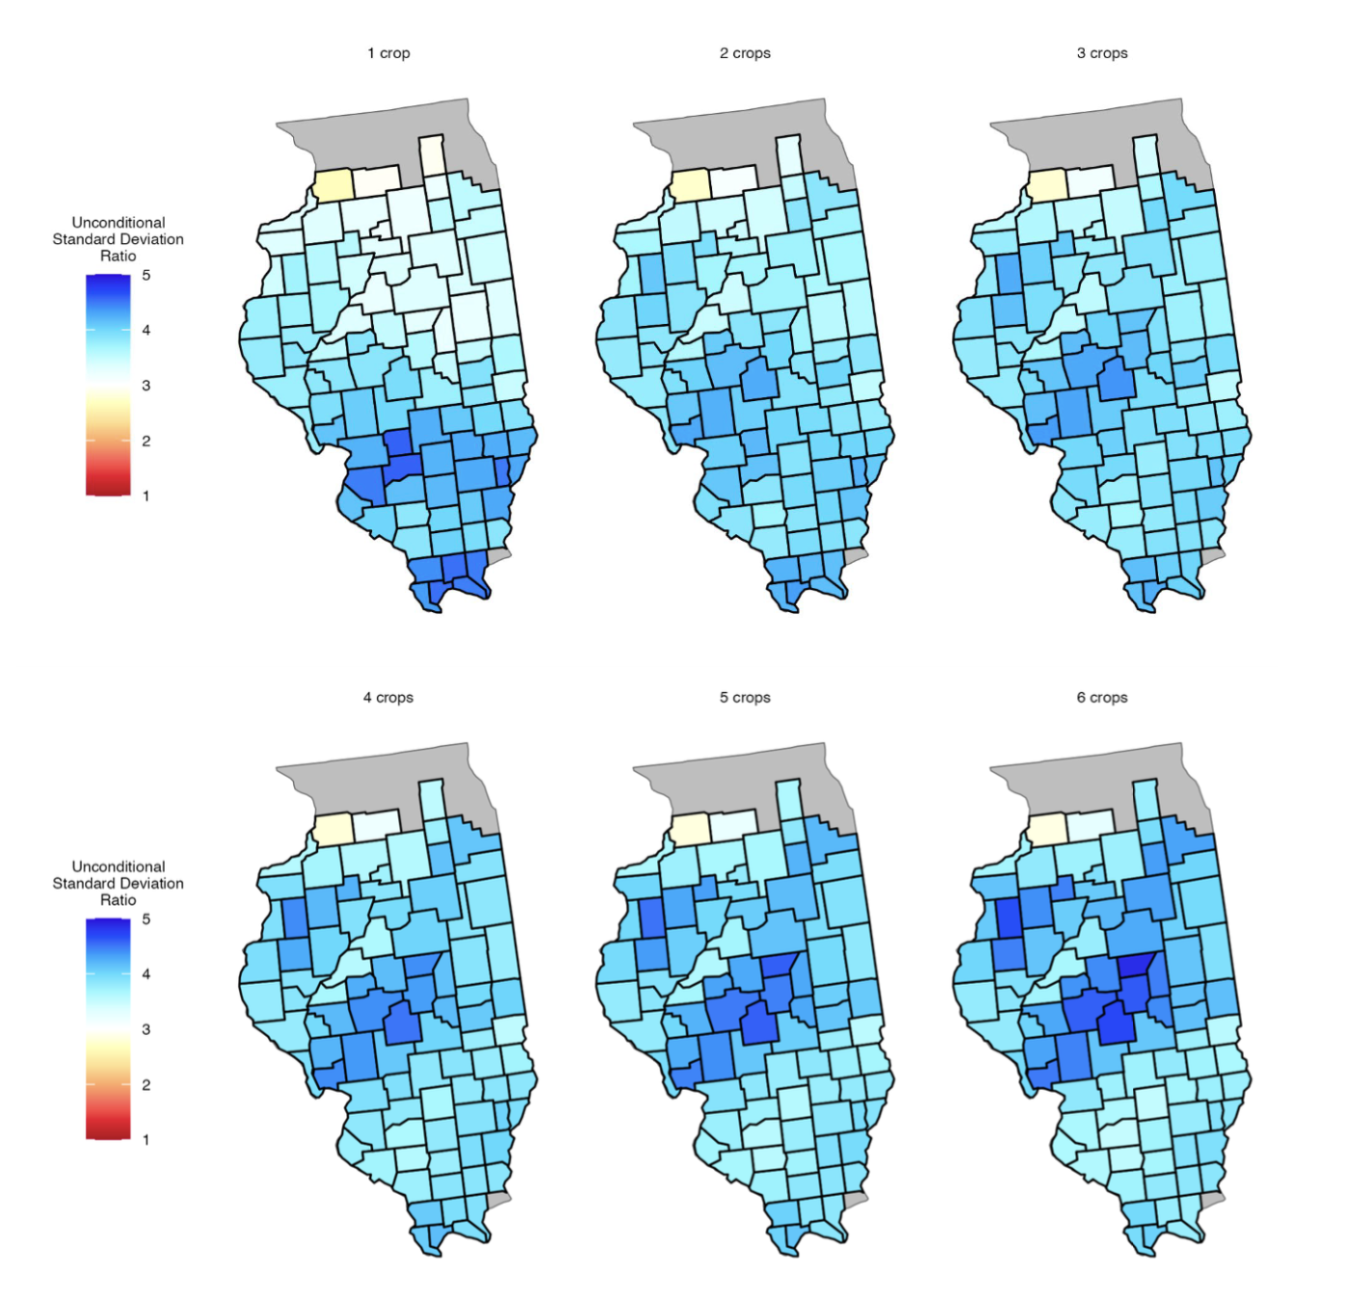
Figure #3 (above): Maps of Unconditional Standard Deviation Ratios for Model 2 (With Price Yield Correlation). These maps illustrate the "risk multiplier" across Illinois, showing that when price uncertainty is introduced, overall revenue risk typically increases by a factor of three to four compared to yield risk alone. Interestingly, this ratio is highest in the most productive regions of Central Illinois. Because these areas have the lowest yield uncertainty, price volatility becomes the overwhelming driver of their remaining financial risk. By accounting for the unique, often negative, price-yield correlations in each county, this model provides a more nuanced spatial "signature" of risk than simpler independent models, confirming that while soil-health practices stabilize yields, they must be understood within the dominant context of global market volatility.
D. Microstructure of farm revenue finance
Our findings highlight that agricultural markets have a unique microstructure.
Unlike financial stock markets, individual farm revenue is often localized at the county level, with corn bid prices that can vary quite significantly from county to county. This highly geographically distributed market structure is unlike any nationally determined stock market or any non-agricultural commodities market.
Unlike financial stock markets, individual large farms in rural areas can exert price pressure on local country grain elevators. This phenomenon exists in Illinois. Our group is studying this market impact problem in other states, where it is a major market force, as in South Dakota.
Furthermore, the shift in harvest dates from Southern to Northern Illinois, and the presence in Illinois of several rail and river grain terminals where corn bids are typically higher than for country grain elevators, suggests that grain marketing timing and location can be further optimized by taking transportation costs and weekly fall-season market dynamics into account.
Conclusion: A New Paradigm for Agricultural Risk
These findings introduce an entirely new modeling methodology in farm-level agricultural microeconomics, while presenting commodity market price uncertainty in a mathematically simple way. By using a summarized version of our yield risk findings, this analysis constructs detailed field-level revenue uncertainty profiles across Illinois, an evaluation method that is fundamentally new to the field.
This framework facilitates the implementation of complex risk analysis by using a mathematically streamlined model for price uncertainty, carefully justified via a detailed analysis of local country grain elevator markets. This innovative approach allows us to calibrate price uncertainty and its county-level relation to yield risk, providing insights that are directly applicable to farm-level decision-making, county-aggregate farm-lending operations, and broader policy and crop insurance design.
Land Core is a 501(c)3 organization with a mission to advance soil health policies and programs that create value for farmers, businesses and communities. The organization is building the missing infrastructure and market-based incentives that will make the rapid adoption and scalability of soil health possible.